Elliott Wave analysis on USD/JPY signals broader pullback [Video]
![Elliott Wave analysis on USD/JPY signals broader pullback [Video]](https://editorial.fxsstatic.com/images/i/USDJPY-neutral-line_XtraLarge.png)
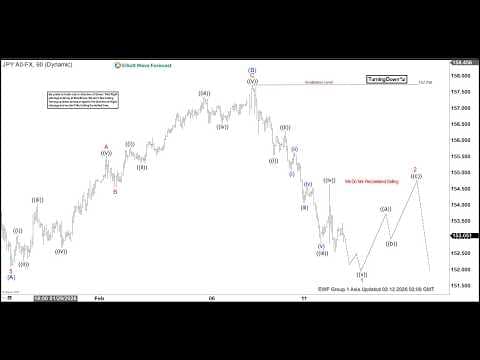
USD/JPY has concluded the cycle from the April 22, 2025 low and is now entering a corrective phase of larger magnitude. From the January 14, 2026 peak, the pair has begun to retrace with internal subdivision unfolding as a zigzag Elliott Wave structure. The initial decline from the January 14 high saw wave (A) finish at 152.08, as shown on the one‑hour chart. Following this, the pair advanced in wave (B), which itself developed as a zigzag of lesser degree. Within this move, wave A ended at 155.51, wave B pulled back to 154.53, and wave C extended higher to 157.7. This completed wave (B) in the larger sequence.
From that point, the pair turned lower in wave (C), which is unfolding as a five‑wave impulse. The initial leg, wave ((i)), ended at 155.51. The corrective rally in wave ((ii)) reached 156.29. Subsequent decline in wave ((iii)) terminated at 152.79. A modest recovery in wave ((iv)) followed, ending at 154.65. The structure suggests that wave ((v)) of 1 remains in progress, with further downside expected before completion. Once wave 1 concludes, a corrective rally in wave 2 should emerge, correcting the cycle from the February 9 high before the broader decline resumes.
In the near term, as long as the pivot at 157.7 remains intact, rallies are expected to fail within the framework of 3, 7, or 11 swings. This reinforces the bearish outlook and highlights the importance of respecting the structural integrity of the Elliott Wave count. The pair continues to navigate its corrective path with measured precision, offering traders a clear framework for anticipating near‑term moves.
USD/JPY 60-minute chart

USD/JPY Elliott Wave [Video]
Author

Elliott Wave Forecast Team
ElliottWave-Forecast.com


