|

Is USD/JPY creating a double top formation? [Video]

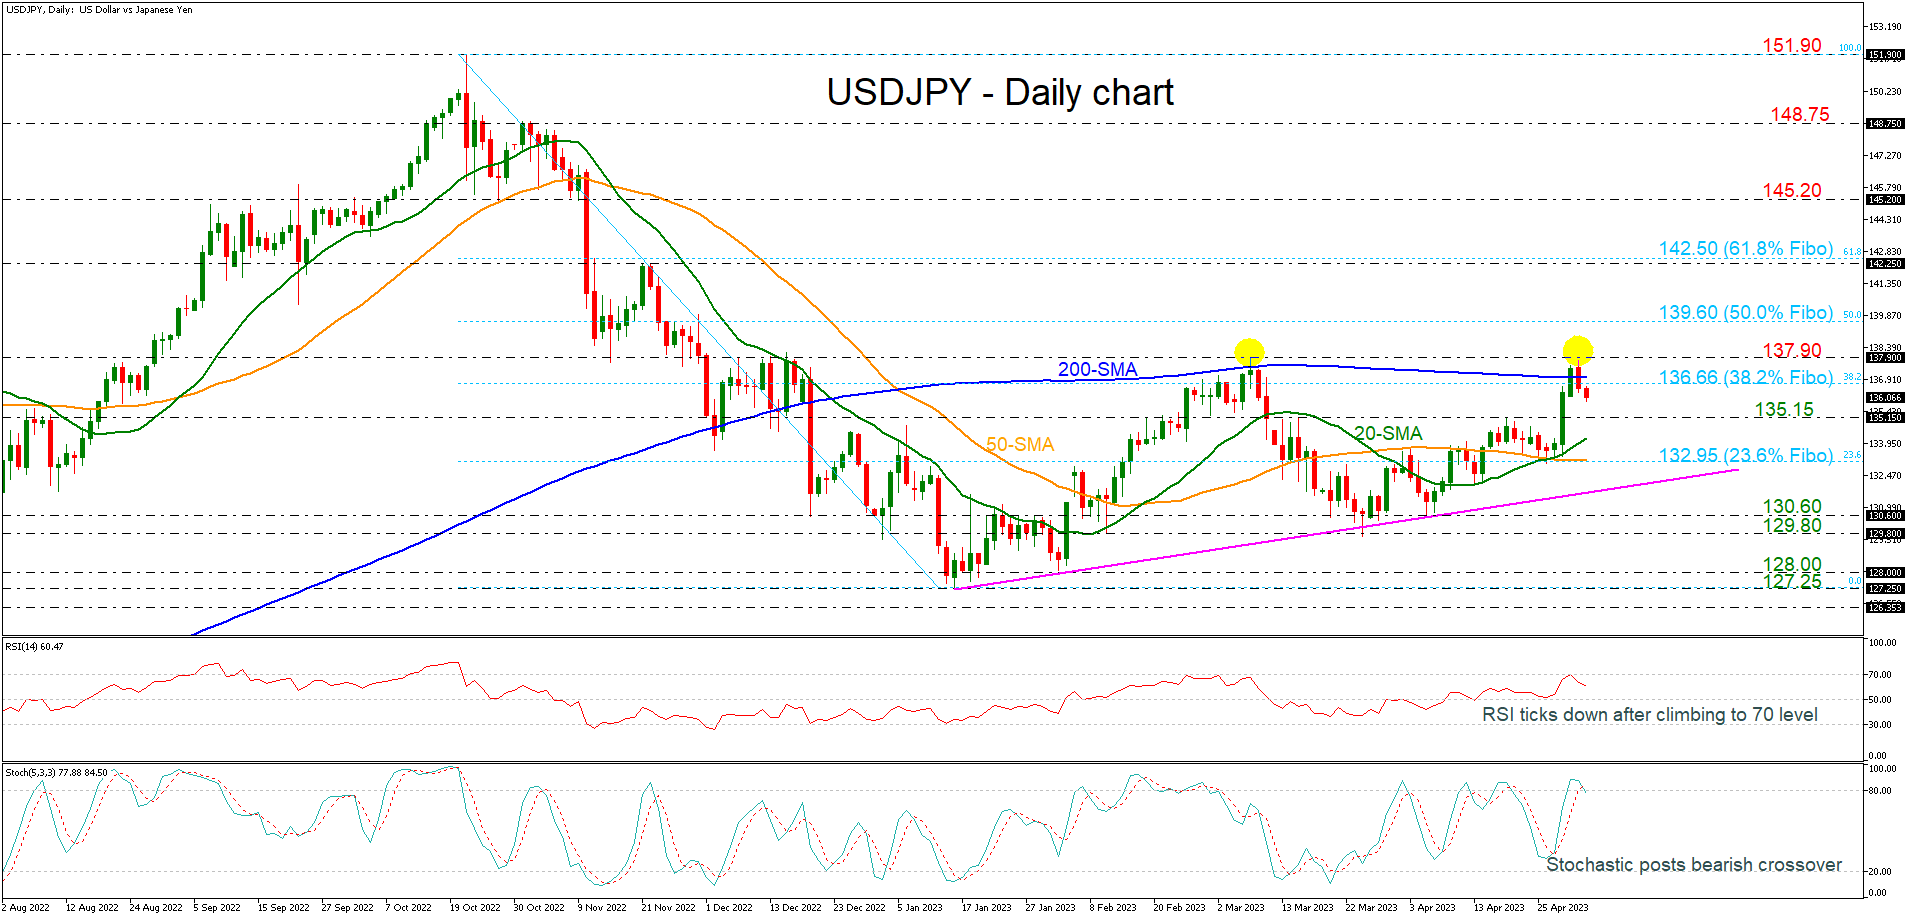
USDJPY plunged below the 200-day simple moving average (SMA) once again after the climb towards the 137.90 resistance level, which is acting both as a significant resistance level and a possible double top pattern is in progress. The pullback below the 38.2% Fibonacci retracement level of the down leg from 151.90 to 127.25 at 136.66 is indicating the start of a consolidation area in the medium-term timeframe.

Technically, the RSI has found strong resistance near the 70 level and dropped lower again, while the stochastic oscillator posted a bearish crossover within its %K and %D lines in the overbought region, suggesting that more losses could come.

More declining movement could meet the 135.15 support ahead of the 20- and the 50-day SMAs at 134.20 and 132.95 respectively, which overlaps with the 23.6% Fibonacci of 132.95. Slightly lower, the uptrend line at 132.14 may halt bearish actions; however, steeper losses could change the outlook to neutral, hitting 130.60.

Otherwise, any successful attempts above the 137.90 barrier could open the way for a rally until the 50.0% Fibonacci of 139.60 and the 142.25 hurdle. Marginally higher, the 61.8% Fibonacci of 142.50 could be the next target.

All in all, USDJPY may give the green light for the start of a double top formation after the touch of the 137.90 level. Only a jump above the aforementioned mark could switch the outlook back to a bullish one. 

USDJPY

Author

Melina Deltas, CFTe

Melina joined XM in December 2017 as an Investment Analyst in the Research department. She can clearly communicate market action, particularly technical and chart pattern setups.

More from Melina Deltas, CFTe
Share:

Markets move fast. We move first.

Orange Juice Newsletter brings you expert driven insights - not headlines. Every day on your inbox.

By subscribing you agree to our Terms and conditions.

Editor's Picks

EUR/USD clings to small gains near 1.1750

Following a short-lasting correction in the early European session, EUR/USD regains its traction and clings to moderate gains at around 1.1750 on Monday. Nevertheless, the pair's volatility remains low, with investors awaiting this weeks key data releases from the US and the ECB policy announcements.

GBP/USD edges higher toward 1.3400 ahead of US data and BoE

GBP/USD reverses its direction and advances toward 1.3400 following a drop to the 1.3350 area earlier in the day. The US Dollar struggles to gather recovery momentum as markets await Tuesday's Nonfarm Payrolls data, while the Pound Sterling holds steady ahead of the BoE policy announcements later in the week.

Gold pulls away from session high, holds above $4,300

Gold loses its bullish momentum and retreats below $4,350 after testing this level earlier on Monday. XAU/USD, however, stays in positive territory as the US Dollar remains on the back foot on growing expectations for a dovish Fed policy outlook next year.

Solana consolidates as spot ETF inflows near $1 billion signal institutional dip-buying

Solana price hovers above $131 at the time of writing on Monday, nearing the upper boundary of a falling wedge pattern, awaiting a decisive breakout. On the institutional side, demand for spot Solana Exchange-Traded Funds remained firm, pushing total assets under management to nearly $1 billion since launch. 

Big week ends with big doubts

The S&P 500 continued to push higher yesterday as the US 2-year yield wavered around the 3.50% mark following a Federal Reserve (Fed) rate cut earlier this week that was ultimately perceived as not that hawkish after all. The cut is especially boosting the non-tech pockets of the market.

Solana Price Forecast: SOL consolidates as spot ETF inflows near $1 billion signal institutional dip-buying

Solana (SOL) price hovers above $131 at the time of writing on Monday, nearing the upper boundary of a falling wedge pattern, awaiting a decisive breakout.