Is USD/INR breaking out of downtrend?

Since the beginning of this month USDINR spot is consolidating within the broad range of 73-73.75. It seems like the spot pair needs more catalyst to break the either side. Technically, it looks like the USDINR spot is going to march towards north especially on the back of strong dollar. In the short term, the dollar index is likely to continue to grind higher on rattled sentiments due to the coronavirus rapid spread in Europe and delay in US administration delays the stimulus package. Previously, traders were betting on faster European economic growth compared to the US but with the rapid increase of the coronavirus cases in the Europe it seems that there are more bets for dollar strength.
However there still exists uncertainty about this year's US presidential election and that the dollar could be prone to more volatile swings. The market's focus will be on next week's first presidential debate of the 2020 election. The debate will be between former Vice President and Democratic nominee Joe Biden and President Donald Trump held on Sep 29. For the past almost three-decades, apart from 2016 elections, the candidate that led going into the debate always won the election. So given the economic, political and social turbulence this year, the debate can have tangible impact on the financial markets. Investors are contend with immediate issues like surging coronavirus cases and bipartisan intransigence over another stimulus bill. So, this first presidential debate may have some politically induced volatility. After the debate, if the polls show an increase in Trump's support, we may see an uptrend in dollar index. The prospect of Trump's reelection means another four-years extension in US-China trade tiff. However, if Biden outperforms, then we can see a reversal in dollar. Meanwhile, technically dollar index has come out of its range-bound channel and breached the top-to-top trend line strong resistance level at 93.50 to hit almost a two months high of 94.251. It is currently trading near 94.125. On upside 94.60 is the strong resistance above which next level is seen at 95.0-95.40. However, if it respected 94.60 then on downside support is located at 93.70-93.30-93.05.
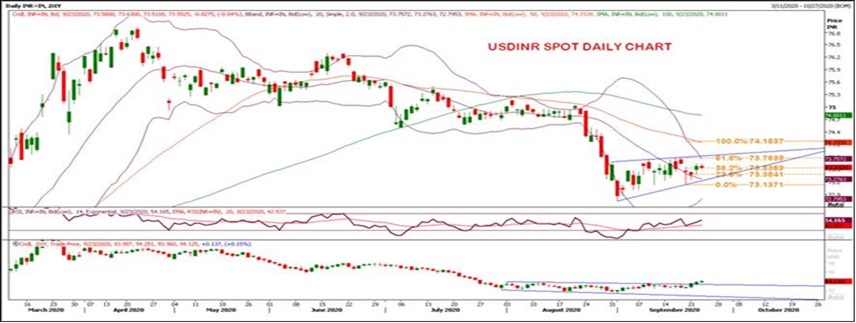
As seen in the chart, the USDINR spot is not breaking the support zone of 73.20/73.25 and also the resistance of 73.75. There are slew of corporate inflows lined up in coming sessions, which may cap the upside in spot. But unless 73.25 doesn't break on the downside, the spot will continue to trade towards 73.75 and above levels. The USDINR ATM volatility index has dropped to 5.8% compared to 6.9% seen on Sep 1. While, the Option Max Pain indicates that the USDINR contract expiry will be close to 73.75.
On technical grounds, the crucial resistance in USDINR is observed at recent high of 73.78 which is also key 61.8% Fibonacci Projections level along with trend line resistance. If the pair sustains above 73.80 then doors will be open for 74.0-74.20 which is near 50 days simple moving average mark. On downside, immediate trend line as well as Bollinger band's medium level support is at 73.27/73.15 (key 61.8% Fibonacci Retracement level) and crucial support is located at 72.90. Consistent trading below 72.90 then only we can see further correction towards 72.75-72.50. However, until it holds the support zone of 73.25/73.15, the USDINR spot will remain sideways with bullish bias.
Author

Rahul Gupta
Emkay Global Financial Services Limited
Rahul Gupta is a derivatives expert with an MBA from Mumbai Educational Trust, having more than a decade year of experience in trading derivatives strategies across asset classes.


