Is the S&P 500 at a make or break level?
Take a look at this chart of the S&P500.
You will note that we are up against the thicker upper blue line which is providing resistance.
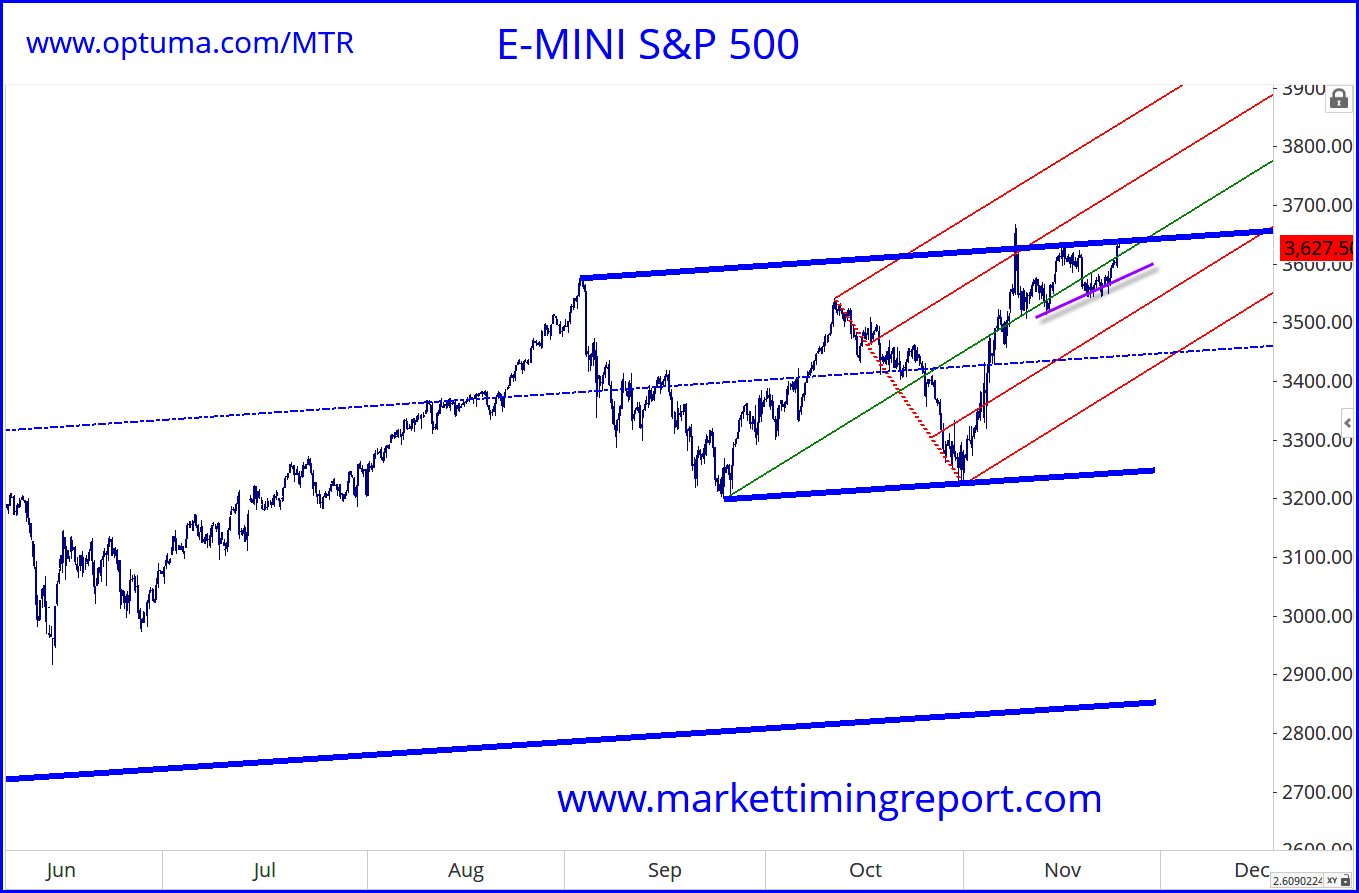
It is possible that the move could fail here.
However we are seeing a series of higher lows caught by the purple trend line. This is potentially bullish.
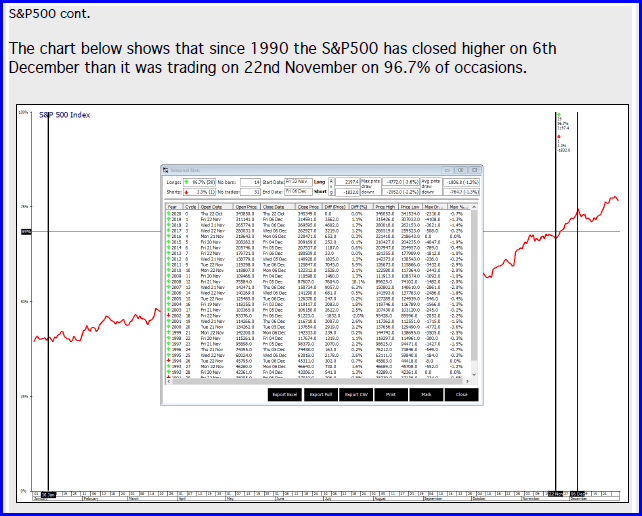
Also, as we published this month, we note that over the last 30 years, the S&P500 Index has closed higher on 6thDecember than it was trading on the 22nd November on 96.7% of occasions.
On the basis of this seasonality it is quite likely that that the index will continue on up through this blue resistance level that is being touched at the time of writing.
Our work also shows that we do see a weekly cycle suggesting a turn as we head into the first week of December. A high is possible towards the end of the first week of December.
Author

Andrew Pancholi
Market Timing Report
Andrew Pancholi is a world-renowned trading expert specializing in market timing.


