Is inflation about to fall off a cliff?
Inflation may have finally peaked around the world, but central banks remain on alert amid an uptick in some countries and the stickiness of underlying price measures in others. Whilst the view that inflation will continue to decline in the coming months hasn’t changed, policymakers are concerned that it’s not coming down fast enough, and this raises the risk that inflation expectations may start to become unanchored. But what if the risk of that happening isn’t very high at all and the real danger for central banks is inflation falling off a cliff?
Overcompensating for a policy mistake?
It goes without saying that inflation is one of the most important economic indicators that policymakers, analysts and investors, as well as the wider public, watch. But that doesn’t detract from the fact that inflation is a lagging indicator, meaning that it measures the changes in price levels after they have occurred and not before it. This makes the job for central banks quite difficult as they have to base their decisions on interest rates on the predicted path of inflation, often leading to policy mistakes, such as in 2021 when the initial warning signs of simmering prices were deemed to be transitory.
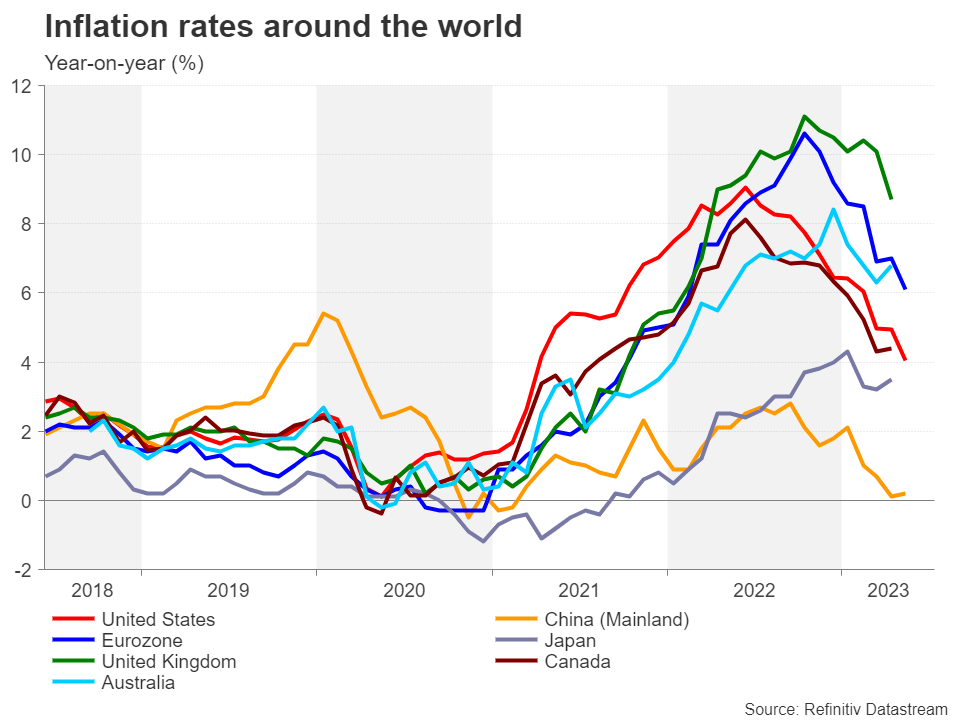
Scarred by that misjudgement, central banks took a very hard line on inflation in 2022 and even now when CPI rates are headed down globally, the likes of the Federal Reserve and European Central Bank are only slowly letting their guards down. This caution seems warranted when considering that consumer demand in just about every region has remained resilient against the rising cost of living and higher borrowing costs, many economies are still experiencing widespread labour shortages and the overall economic pain of the most aggressive tightening cycle in decades has been surprisingly small.
Guided by inflation expectations
However, the fight against high inflation has probably reached its most crucial stage as policymakers have to factor in the substantial policy tightening that’s already in the pipeline against the need for additional rate hikes amid the sticky price pressures. Hence, there is increasing attention on the various leading indicators of inflation for clues on its future trend.
Measures of expected inflation are the foremost leading indicators that central bankers keep an eye on. For the US, there are some very encouraging signals from the two- and five-year breakeven inflation rates as these market-based gauges have settled just above 2%. But this is not a very conclusive sign as they were not particularly great at predicting the extent of the price surges in 2021 and 2022 and they should ideally be hovering slightly below 2% rather than above it, as was the case in the decade before the pandemic.
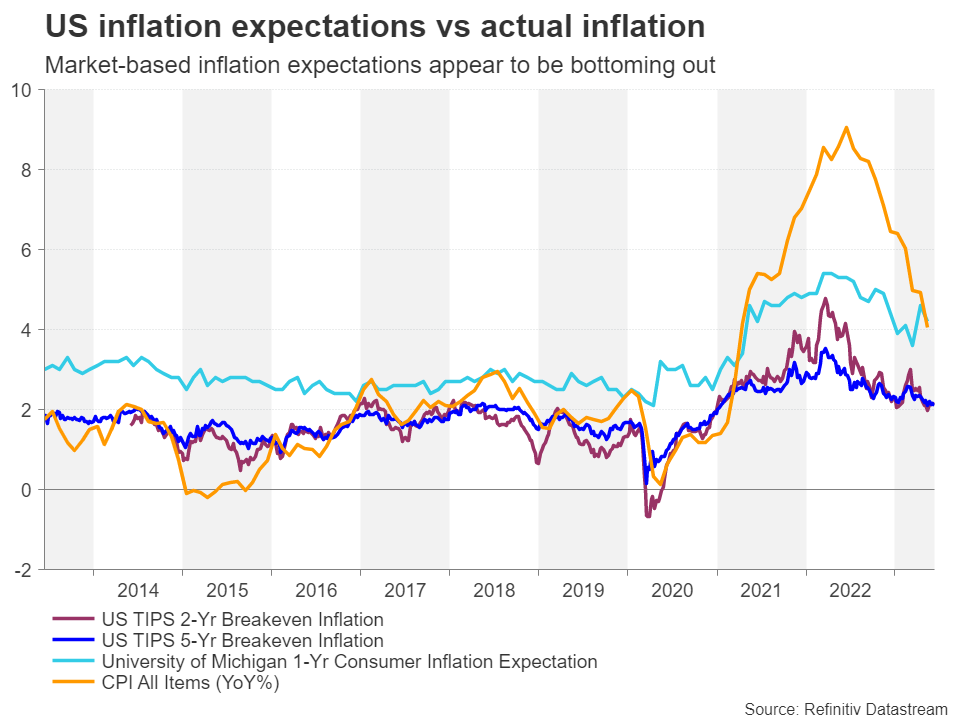
Moreover, a closely watched consumer-based expectation of inflation – the University of Michigan’s one-year inflation expectation – has edged up lately. Taken together, they could be interpreted as suggesting that the decline in inflation has stalled. In the euro area, inflation expectation based on the 5-year/5-year swap rate may not have even peaked yet and remains elevated near the all-time high of 2.58% set in May.
Money supply growth is plunging
But other leading indicators paint a much more promising picture, and in some extreme cases, even a worrying one of disinflation going too far. One major red flag is the sharp drop in money supply growth in both the US and Eurozone. M2 growth in the US turned negative for the first time on record at the end of 2022 and European M2 growth is headed in the same direction. Although the pandemic stimulus is likely distorting these readings, the implied path does nevertheless point to further dramatic falls in inflation over the next 12 months.
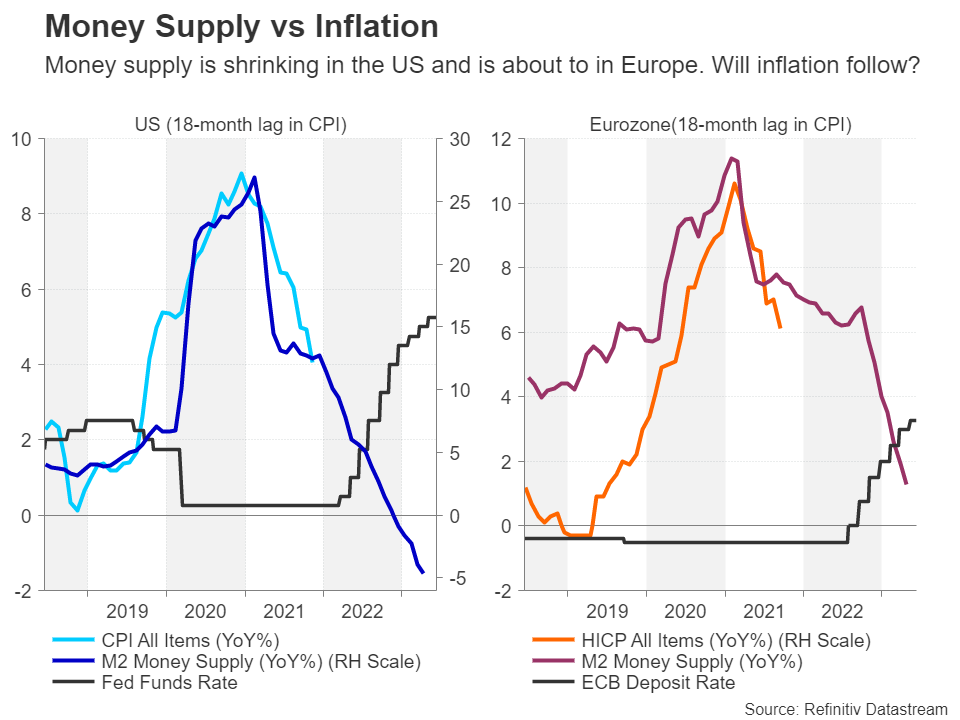
As demonstrated in the charts above, the series of rate hikes on both sides of the Atlantic are having a clear impact in contraining money supply, though this should not be confused with net liquidity changes in the economy.
The only way is down
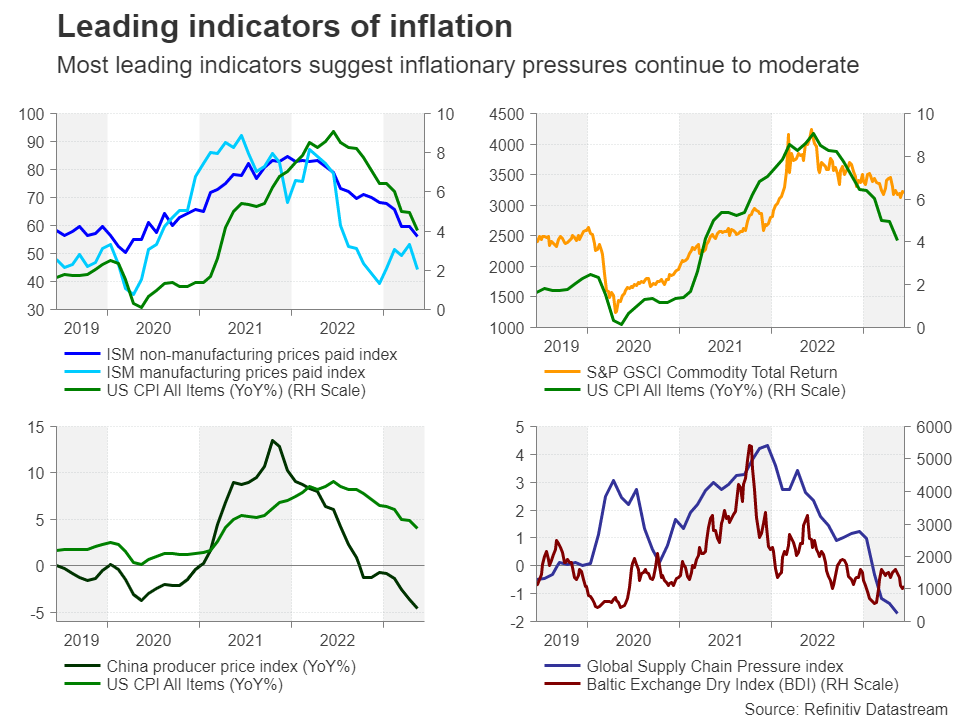
Another key indicator, one that is popular with investors, is the ISM prices paid index. Again, the trend here is downwards, particularly for non-manufacturing prices, and while manufacturing prices may have started to creep slightly higher, the drop in services inflation carries a lot more weight for the Fed as this has been its primary focus this year.
In addition, manufacturing prices in the US and globally have a close correlation with the price of goods coming out of China’s factories, which have been declining year-on-year since late 2022, signalling more disinflation is on the way. Reinforcing this view are the decreases in other industry indicators such as freight costs and supply pressures. One area of disappointment is commodity prices, which have yet to fully reverse their gains from the Ukraine war and crude oil is one of the few exceptions.
Overtightening fears
But on the whole, everything is pointing to inflation decelerating further this year and this raises the question, have central banks overtightened? Well, the jury is out on that and it will probably be a while before the outcome of the past year’s policy actions emerges.
However, with the rate-hike cycle now nearing the end in most Western economies, the angst about overtightening won’t simply vanish for investors when central banks go on a permanent pause and will linger on for the duration that they decide to hold rates at peak levels. The longer that rates are kept high, the greater the risk of recession fears eventually materializing.
Author

Mr Boyadjian graduated from the London School of Economics in 1999 with a BSc in Business Mathematics and Statistics. Following graduation, he joined PricewaterhouseCoopers in the Business Recoveries team, where he was responsibl


