Is a Local Top in Gold At Hand?

In yesterday’s analysis on gold price in December 2019, we wrote that while the outlook for the yellow metal for the following months was bearish, it was bullish for the short term. And indeed – gold, silver, and mining stocks rallied. In fact, the rally continues in today’s pre-market session. As it’s happening even without a decline in the USD Index, many investors might think that something more than a short-term rally is actually taking place. But is that really the case?
The odds are that it’s not, and that we’re actually seeing a business-as-usual kind of situation. That is if one knows the details of the gold trading business.
The key detail in the current gold-USD dynamics is its shape and strength during the final part of the moves in both USD and gold. Long story short, gold tends to react much more to the final moves in the USD Index than to the ones that we see initially or in the middle of the USD movement.
USD Index Done Pulling Back?
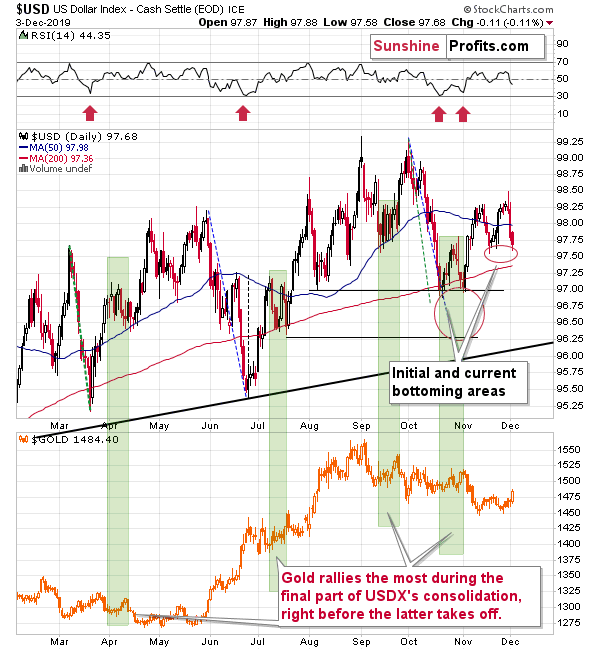
What do we see right now in the USD Index? Most likely, it’s the final part of the its pullback that we predicted when the USDX was topping in mid-November. The size of the decline is in tune with previous similar cases, and so is the time factor.
We marked the similar cases with green rectangles. All the setups are similar in terms of shape, and half (two) of them are similar in terms of the price action that preceded the consolidation (sharp rallies). In all four previous cases, the USD Index moved back and forth. Twice (July and October) it created two distinct bottoms, and twice (April and September) it moved quickly up and down, creating multiple intraday tops and bottoms.
In all cases, it took about two weeks before the USD Index started to rally. Moreover, in cases that were preceded by a sharp rally – just like the early-November upswing – the USDX corrected less than half of the upswing. It also declined until moving to the previous local extreme. In case of the April correction, it was the mid-Feb top, and in case of the July correction, it was the early-June bottom.
Right now, we have a situation when the USD Index has been correcting for about 2 weeks, it corrected a bit less than half of the preceding upswing and it appears to be bottoming (second distinct bottom) close to the previous local extreme (late-October top). The history seems to be rhyming.
What does it mean to gold? The same thing it meant previously. If you look at the lower part of the chart and focus on what happened when the green rectangles were drawing to their ends, you’ll see that gold rallied relatively strongly at that time after being more or less muted previously. That’s exactly what we see this week.
What does it mean? It means that gold is most likely in the final part of its rally and that we should expect to see a local top any day now.
Apart from summarizing the outlook of our long position opened right after the November 12 reversal, the full version of this analysis features the comprehensive short-term precious metals analysis, and the valuable sign from yesterday’s action in silver. Bottom line, these are superb tools in planning when and where to profitably switch market sides – just as our preceding success with the earlier short position. Profit along with us.
Want free follow-ups to the above article and details not available to 99%+ investors? Sign up to our free newsletter today!
Want free follow-ups to the above article and details not available to 99%+ investors? Sign up to our free newsletter today!
Author

Przemyslaw Radomski, CFA
Sunshine Profits
Przemyslaw Radomski, CFA (PR) is a precious metals investor and analyst who takes advantage of the emotionality on the markets, and invites you to do the same. His company, Sunshine Profits, publishes analytical software that any


