Interest Rates: Making the improbable today’s reality

The US Federal Reserve has raised its interest rate guidance for 2023; and potentially late 2022. Oddly enough, interest rates have moved lower since the last Fed meeting.
I see an opportunity today.
You would think that the higher interest rate guidance would have created a bump higher in the $TNX (Ten-Year Note Yield). However, wouldn’t that make too much sense? The more trading experience I have gotten over the last two decades, the clearer it is, that logic doesn’t always work - unless you are early enough.
If you have been following along, you know that yesterday, I discussed the S&P Banking sector, namely KBE, as we wait for a pullback to some key technical levels.
It got me thinking: the Ten-Year Note yield should be very similar to that trade.
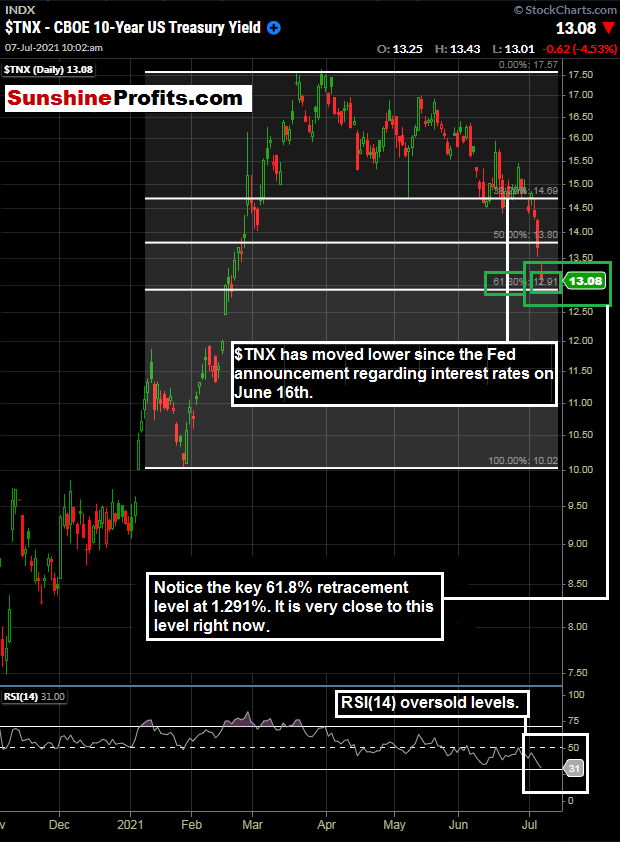
Figure 1 - Ten-Year Treasury Note Yield November 3, 2020 - July 7, 2021, 10:10 AM, Daily Candles Source stockcharts.com
We can see that the 10-year note yield has declined since June 16th’s Fed meeting. We are approaching daily oversold levels via the RSI(14). I think it is safe to say that many traders that took this trade (especially with leverage) have reached or are reaching their point of maximum pain. Notice how this chart looks very similar to the chart regarding KBE in yesterday’s publication.
Higher interest rates can create net interest margin expansion for banks and can boost the bottom line. Lower rates may have contributed to the fall in KBE over the last few weeks.
But Wait, There’s More
There were simply too many technical indicators to fit on one chart on this one. So, let’s take another look at interest rates, but this time in the form of TLT iShares 20+ Year Bond ETF. Let’s further out in time with daily candles here.
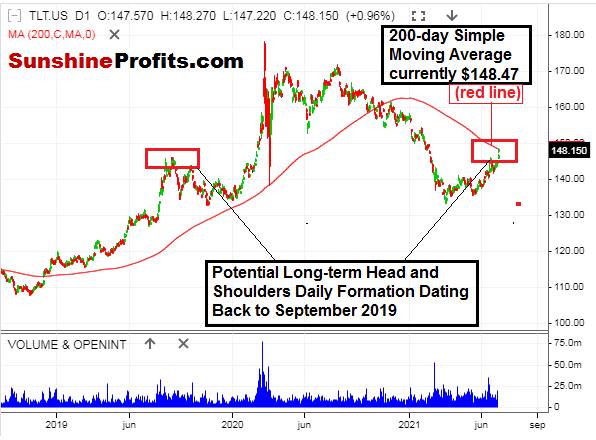
Figure 2- TLT iShares 20+ Year Bond ETF September 10, 2018 - July 7, 2021, DailyCandles Source stooq.com
I like the fact that numerous indicators are showing that interest rates may be due to head back in the “correct” direction. We have a long-term potential head and shoulders pattern, the 200-day moving average in TLT. We also have the key 61.8% Fibonacci retracement level in $TNX. Putting all of this together makes sense for a trade opportunity.
Perhaps since most traders that took the “logical” trade on the Fed announcement back on June 16th have had enough and reached a point of maximum pain, it can be our turn for a trade.
There are indeed numerous ways that a trader can trade interest rates. There are different products, durations, and instruments. Many traders are not familiar with interest rate futures; they are quoted differently and have margin requirements that may not be suitable for many traders.
I happen to like the TLT as the preferred instrument here. It is the longer end of the curve (20+ years) and is extremely liquid. The longer end of the yield curve can provide more price volatility versus the shorter end, and I strongly like the longer-term head and shoulders pattern that could be forming in the TLT.
Putting all of this together makes me consider Selling TLT when $TNX trades between 1.291% - 1.310% or at the 200-day near moving average of TLT ($148.47). Let's call it $148.47 - $148.00.
It looks like this TLT trade could be triggered at any time today.
Want free follow-ups to the above article and details not available to 99%+ investors? Sign up to our free newsletter today!
Premium
You have reached your limit of 3 free articles for this month.
Start your subscription and get access to all our original articles.
Author

Rafael Zorabedian
Sunshine Profits
After spending years as an active trader across several capital markets, Rafael earned his stripes as a former futures and options broker specializing in equity indices, energies, metals, and soft commodities.


