Insights for the Asian Forex trading session Tuesday 16/10/2018

Insights for the Asian Forex trading session Tuesday 16/10/2018
* Japan Industrial Production MoM (Aug) - Down 0.2% from 0.7% forecast and 0.7% from the previous period)
* U.S. Core Retail Sales MoM (Sep) - Down -0.1% from 0.4% forecast and 0.2% from the previous period
* U.S. Retail Sales MoM (Sep) - Down 0.1% from 0.7% forecast and 0.1% from the previous period
Tuesday's macro summary
* New Zealand Consumer Price Index (CPI) QoQ (Q3) - 8.45 hrs
* Reserve Bank of Australia Meeting Minutes - 11.30 hrs
* China Consumer Price Index (CPI) MoM, YoY (Sep) - 12.30 hrs
* China Producer Price Index (PPI) YoY (Sep) - 12.30 hrs
* U.K. Average Earnings Index +Bonus (Aug) - 19.30 hrs
* U.K. Claimant Count Change (Sep) - 19.30 hrs
* U.K. Employment Change 3M/3M - 19.30 hrs
* Italy Consumer Price Index (CPI) MoM (Sep) - 20.00 hrs
* Germany ZEW Current Conditions (Oct) - 20.00 hrs
* Germany ZEW Economic Sentiment (Oct) - 20.00 hrs
* Eurozone Trade Balance (Aug) - 20.00 hrs
* Eurozone ZEW Economic Sentiment 20.00 hrs
* U.S. Industrial Production MoM (Sep) - 00.15 hrs
* U.S. JOLTs Job Openings (Aug) - 01.00 hrs
The FX Majors Current positions and its future forecast
What is going on now with AUD/USD?
AUD/USD: The Australian dollar retreated from the top of the price channel to around 0.70935 in yesterday's session but managed to recover during the European session and returned to the top of the price channel.
Our forecast
AUD/USD: The Australian dollar currently trades at 0.71315 and might pull back to 0.71220 and 0.71100 if it fails at 0.71360. The pair needs to maintain above 0.71360 to continue to its next target at 0.71580
Support - 0.71220, 0.71100, and 0.70935
Resistance/Target - 0.71360, 0.71580, and 0.71880
The trade signals are posted on to our Telegram channel on a regular basis as per the link below.
https://t.me/leoprimefx
Chart 1: The short-term view of the AUD/USD price action in the 60 minutes price chart highlights the direction of the trend and the support and resistance price points

Chart 2: The short-term view of the AUD/USD price action in the four hours price chart highlights the direction of the trend and the support and resistance price points

What is going on now with EUR/USD?
EUR/USD: The Euro bounced at the bottom of the price channel in yesterdays opening trades and reached its estimated targets at 1.15785 and 1.15930 before pulling back to its 500 EMA during the European session. The pair failed to maintain above its 500 EMA and finished the overnight session at 1.15785.
Our forecast
EUR/USD: The Euro currently trades at 1.15792 in this mornings session and needs to maintain above 1.15785 support to head back up. The pair could fall to the bottom of the price channel at around 1.15560 if it fails at 1.15785
Support- 1.15785, 1.15560, and 1.15370
Resistance/Target - 1.15930, 1.16085, and 1.16235
The trade signals are posted on to our Telegram channel on a regular basis as per the link below.
https://t.me/leoprimefx
Chart 1: The short-term view of the EUR/USD price action in the 60 minutes price chart highlights the direction of the trend and the support and resistance price points
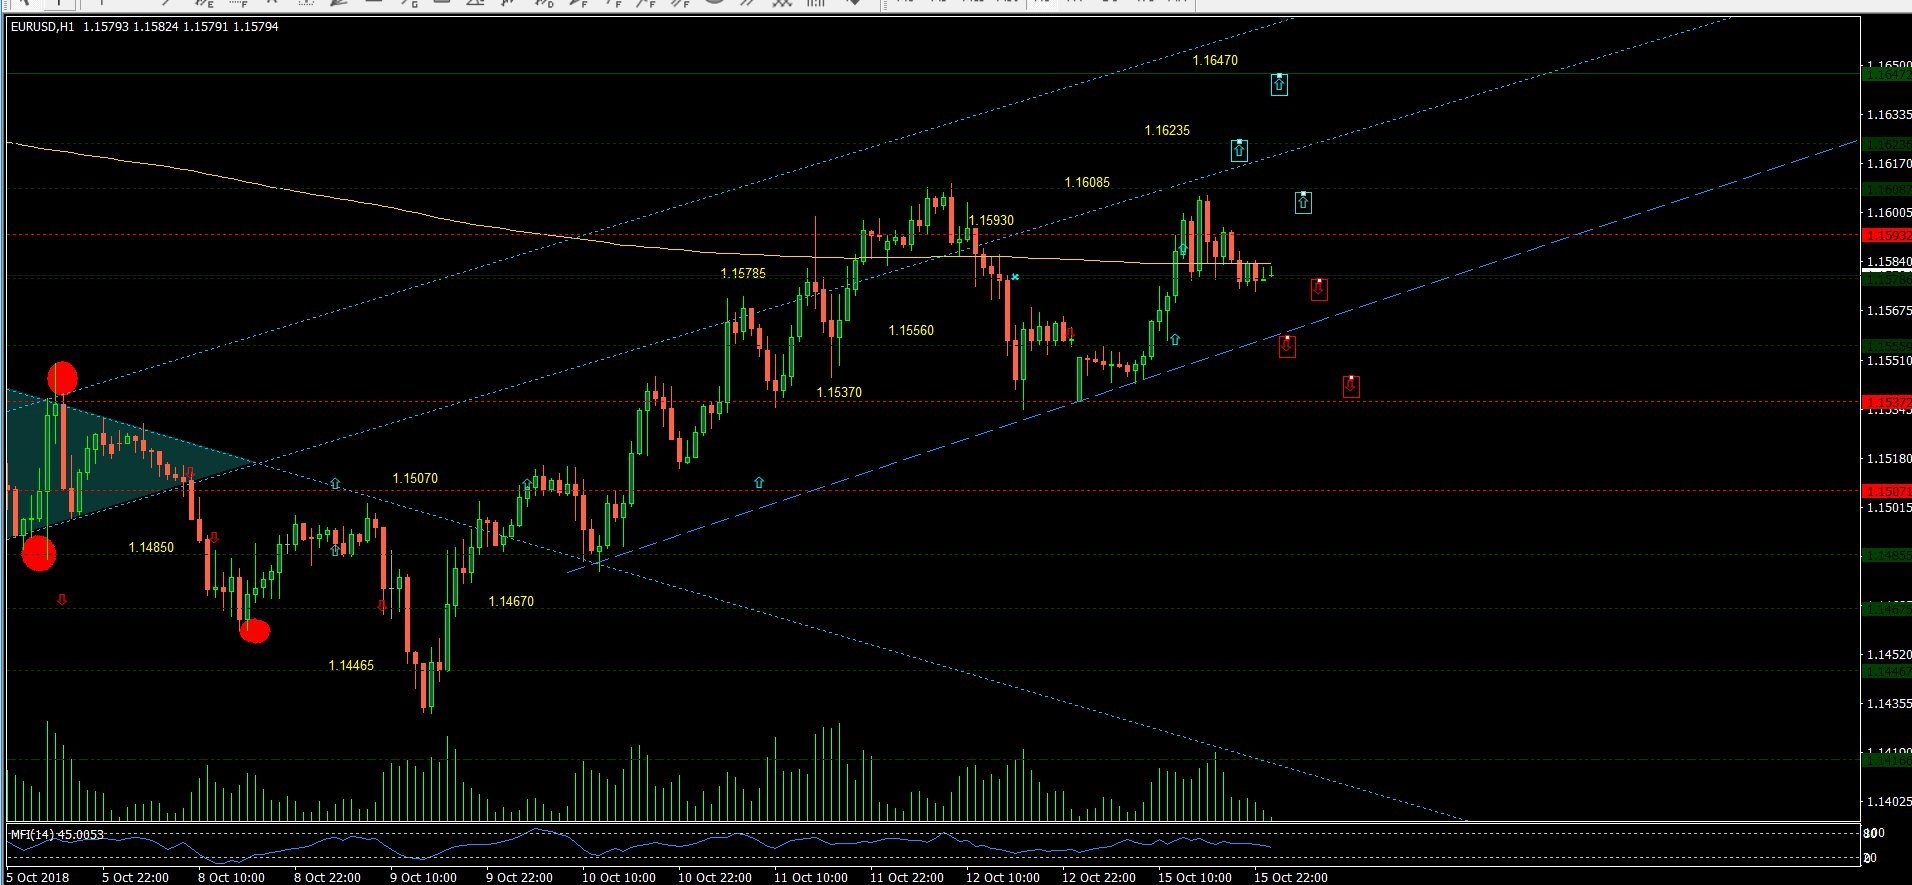
Chart 2: The short-term view of the EUR/USD price action in the four hours price chart highlights the direction of the trend and the support and resistance price points

What is going on now with GBP/USD?
GBP/USD: The Pound gapped down in yesterdays opening trades but managed to bounce at around its 500 EMA in the 60 minutes time frame and took off to the upside. The pair reached 1.31785 before pulling back to 1.31435 during the European session.
Our forecast
GBP/USD: The Pound has been consolidating at 1.31785 and 1.31435 for the past eight hours in the 60 minutes price chart and would continue until it breaks out. A break above 1.31785 could see the pair continue to 1.32145 and 1.32500. A break below 1.31435 could see the pair fall to 1.31170 and 1.31020.
Support -1.31435, 1.31170, and 1.31020
Resistance -1.31785, 1.32145, and 1.32500
The trade signals are posted on to our Telegram channel on a regular basis as per the link below.
https://t.me/leoprimefx
Chart 1: The short-term view of the GBP/USD price action in the 60 minutes price chart highlights the direction of the trend and the support and resistance price points
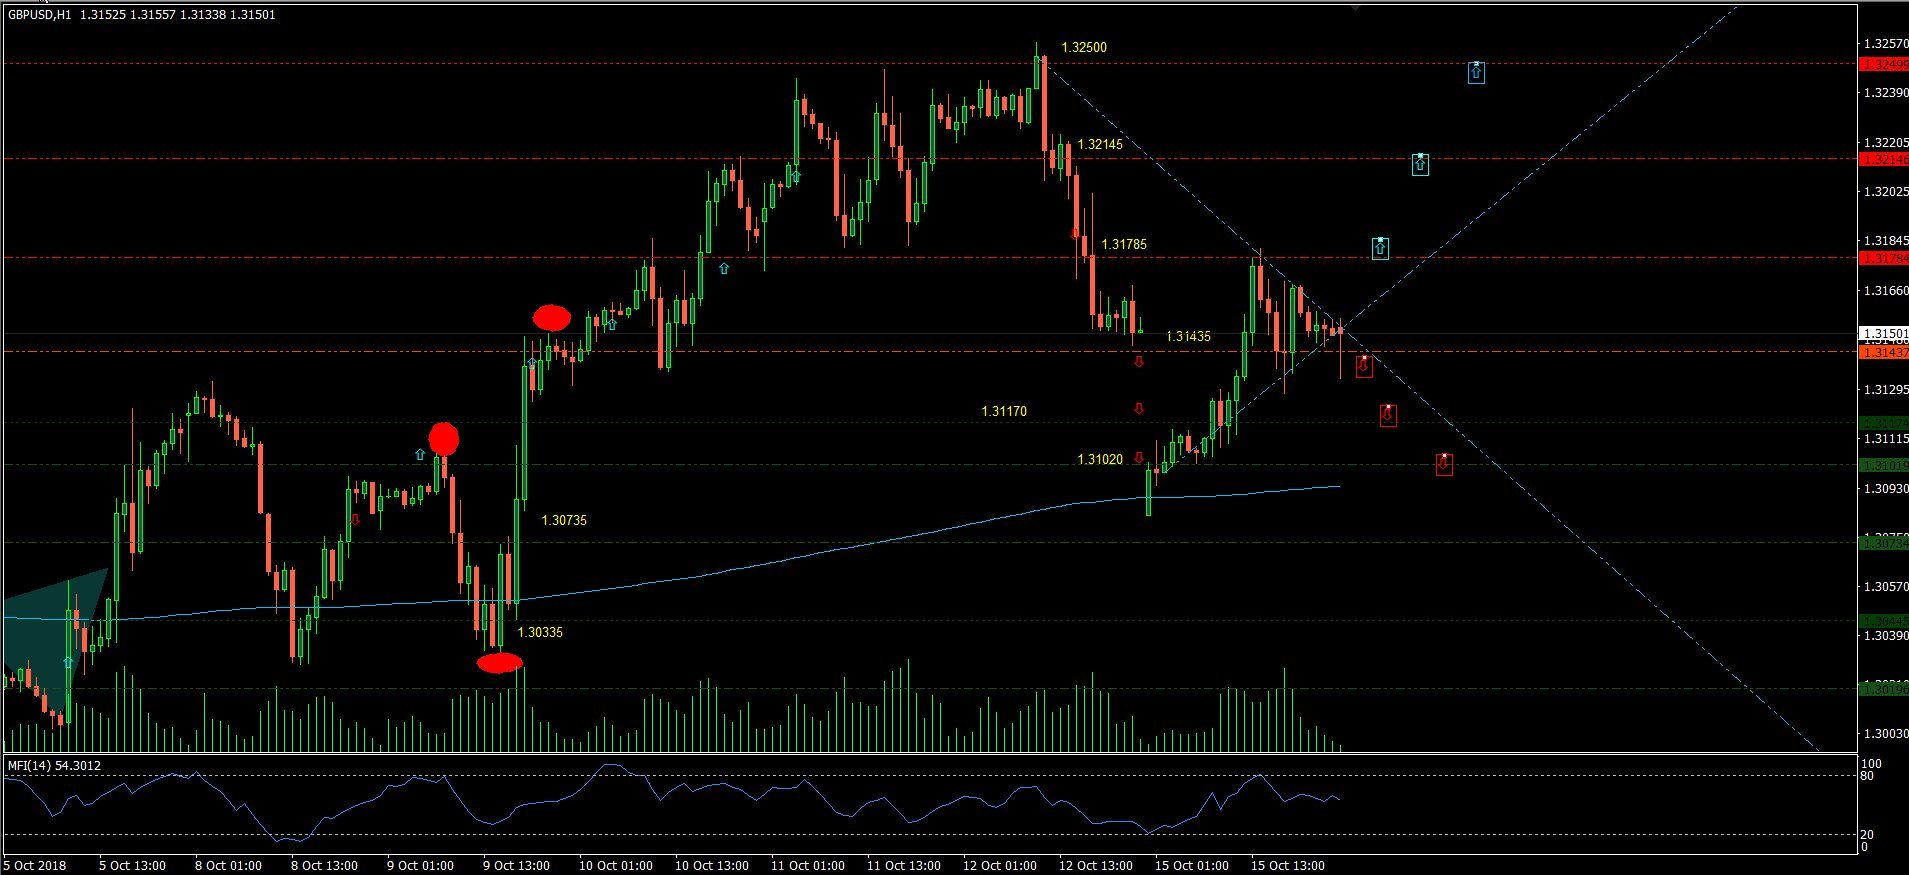
Chart 2: The short-term view of the GBP/USD price action in the four hours price chart highlights the direction of the trend and the support and resistance price points

What is going on now with USD/JPY?
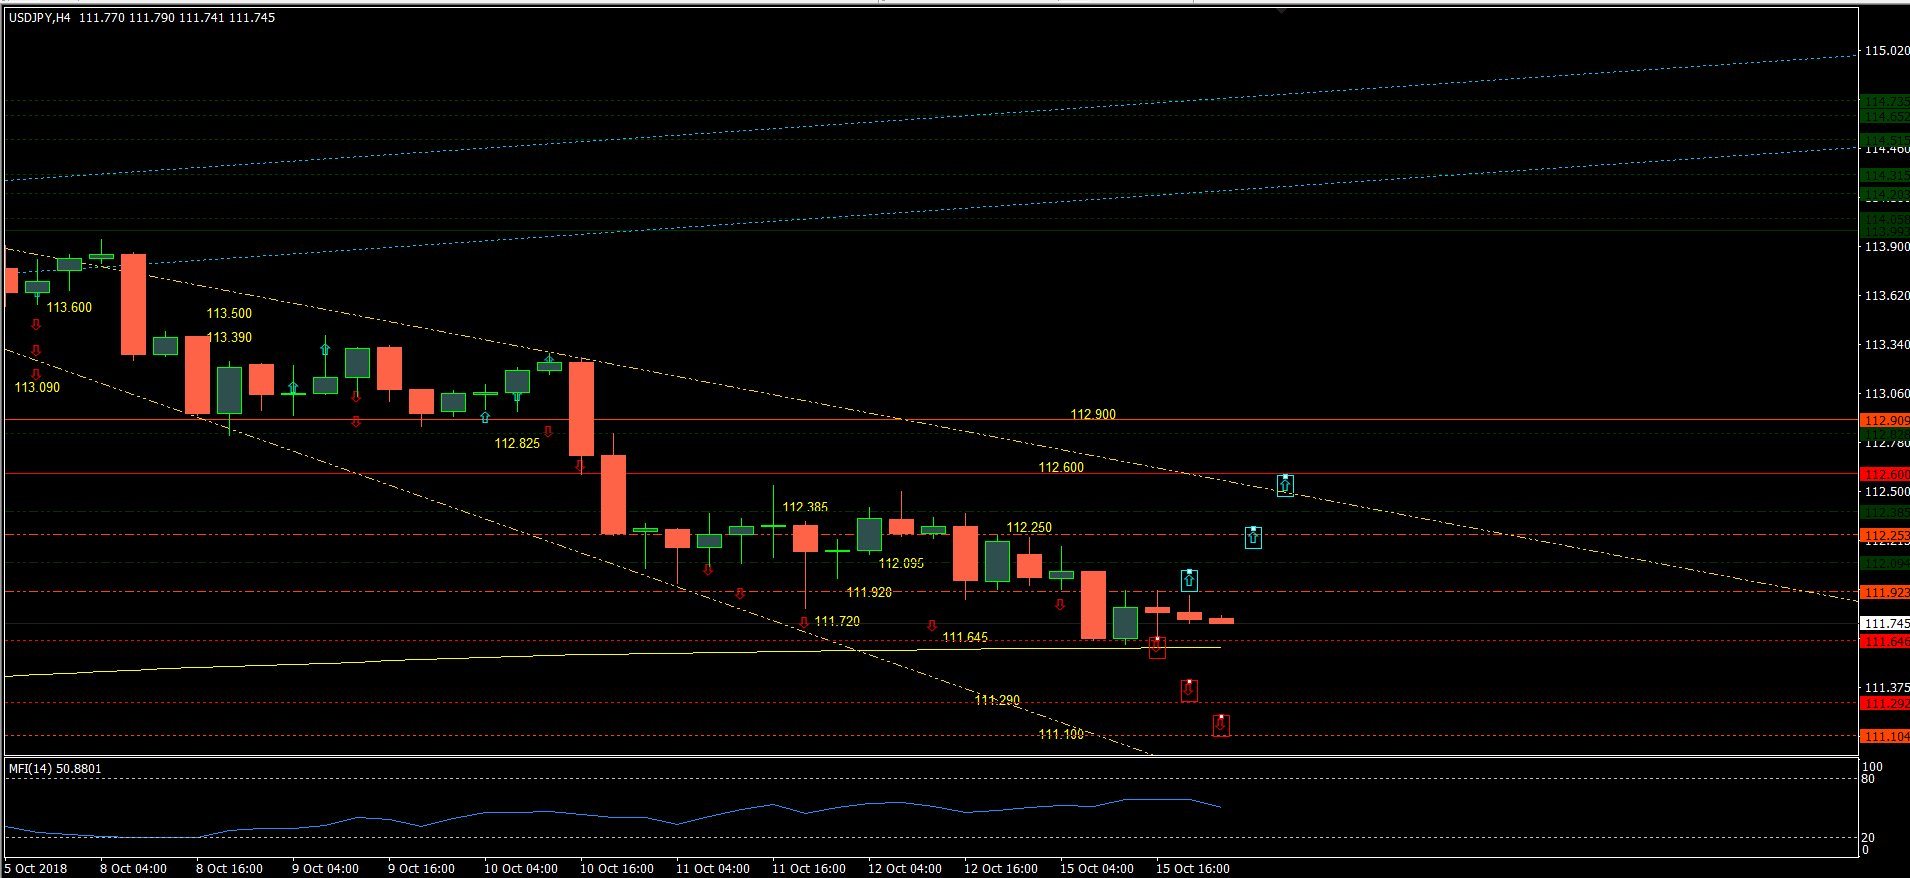
USD/JPY: The US dollar failed to continue to 112.250 after three hours from yesterdays opening trades and slipped below 112.905 support. The pair continued down, piercing through 111.920 support during the European session but was supported at 111.645.
Our forecast
USD/JPY: The US dollar spends most of the time during the overnight session consolidating at 111.920 and 111.645 and continued in this morning session. A break above 111.920 could lead the pair to 112.250 and 112.600. A break below 111.645 could push the prices further down to 111.290 and 111.100
Support -111.645, 111.290, and 111.100
Resistance/ target - 111.920, 112.250, 112.600, and 112.900
The trade signals are posted on to our Telegram channel on a regular basis as per the link below.
https://t.me/leoprimefx
Chart 1: The short-term view of the USD/JPY price action in the 60 minutes price chart highlights the direction of the trend and the support and resistance price points

Chart 2: The short-term view of the USD/JPY price action in the four hours price chart highlights the direction of the trend and the support and resistance price points
What is going on now with USD/CAD?
USD/CAD: The US dollar spends most of the Asian trading session in yesterday's trades consolidating at 1.30390 and 1.29945. The pair fell below the consolidation channel during the European session at 1.29945 after two failed attempts to break at 1.30390. The pair found support at 1.29535 and finished the overnight session just above its 500 EMA line in the 60 minutes time frame.
Our forecast
USD/CAD: The US dollar currently trades at 1.29848 and might continue to 1.29945 if it maintains above its 500 EMA and 1.29770. The pair could fall to 1.29535 and 1.29365 if it fails at its 500 EMA and 1.29770 support.
Support - 1.29770, 1.29535, and 1.29365
Resistance/Target - 1.29945, 1.30390, and 1.30720
The trade signals are posted on to our Telegram channel on a regular basis as per the link below.
https://t.me/leoprimefx
Chart 1: The short-term view of the USD/CAD price action in the 30 minutes price chart highlights the direction of the trend and the support and resistance price points

Chart 2: The short-term view of the USD/CAD price action in the four hours price chart highlights the direction of the trend and the support and resistance price points

Author

Denis Joeli Fatiaki
Independent Analyst
Denis Joeli Fatiaki possesses over a decade of extensive experience as a multi-asset trader and Market Strategist.