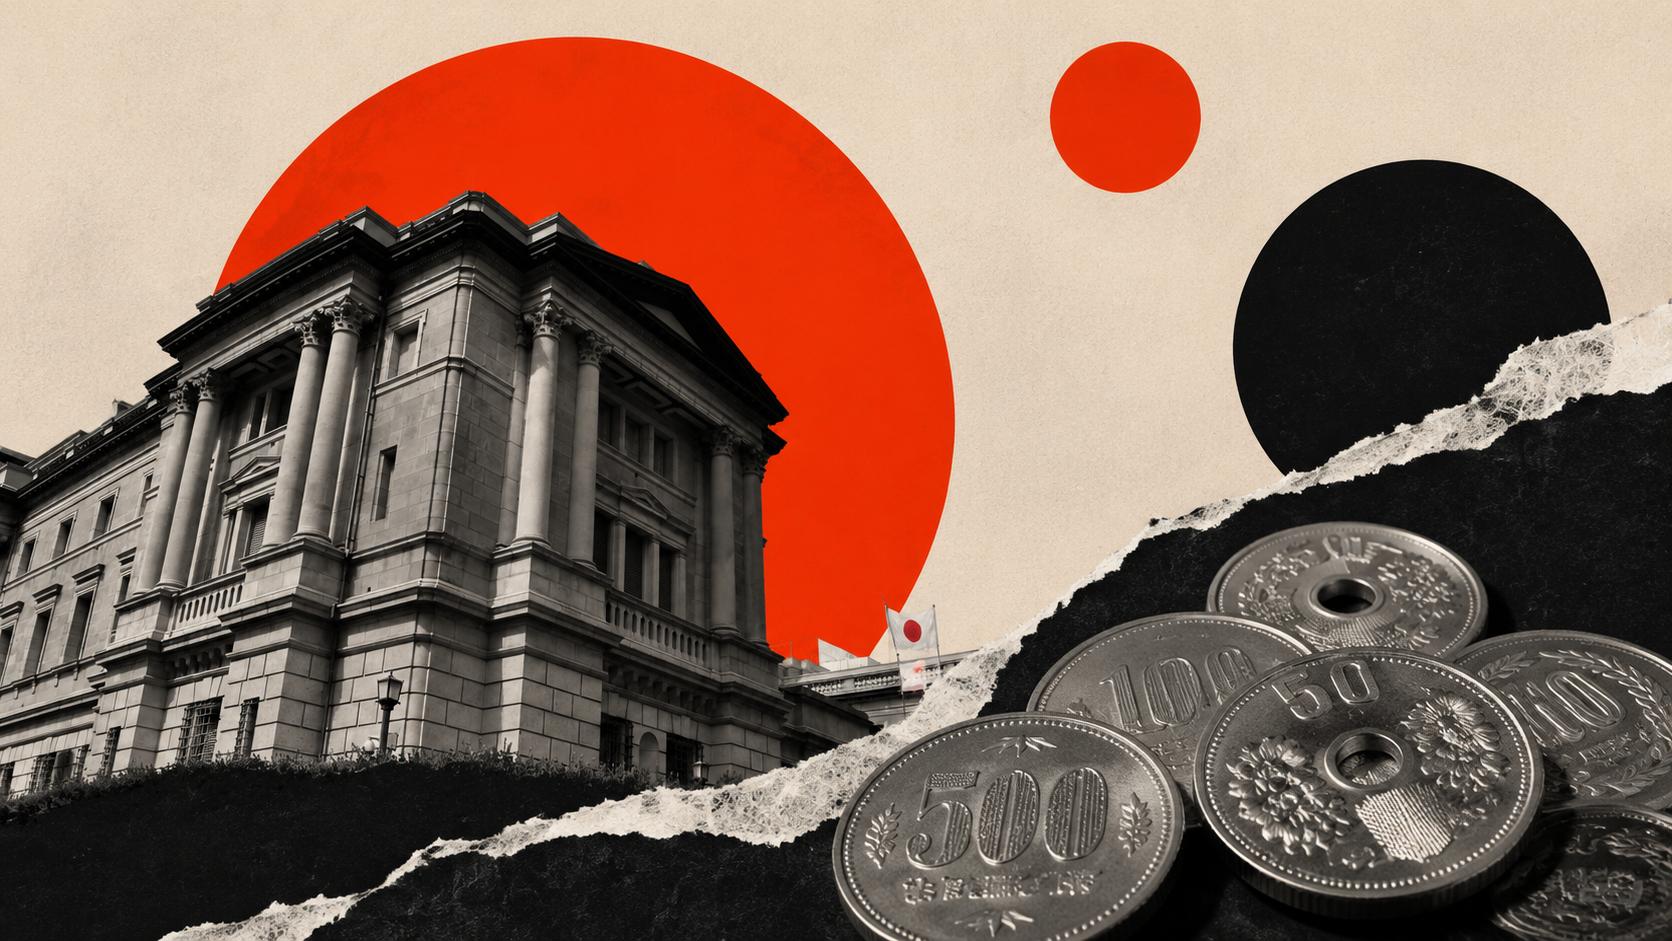
Silver's vault build: Why It isn't the top it looks like
Silver has had a violent few weeks.
It fell to around $68 an ounce in early June as a run of strong economic data pushed the Federal Reserve toward higher-for-longer, and it has since bounced back toward $70 after a US-Iran peace framework eased the energy shock that had been feeding inflation. For anyone holding silver, though, the more unsettling story during the selloff was not the price. It was the plumbing. The warehouses that back the silver futures market were filling up, and the US Mint sold zero American Silver Eagles in May. On its face, that looks like the silver shortage everyone has been talking about is finally over. It is not, and the reason matters more than the headline.
As of June 16, silver trades near $70.40 an ounce, up roughly 90% from a year earlier and roughly flat on the year, though still about 42% below its January high near $121.67. The gold-silver ratio has tightened back toward 61.5. The macro tape is doing most of the driving right now. Markets have largely priced out the December rate-hike risk that drove the early-June selloff, and the Federal Reserve under new chair Kevin Warsh holds its first meeting on June 16 and 17, with a decision expected to leave rates unchanged.
The research behind this issue comes from the Silver Engineer at Golden Meadow, who tracks more than a hundred separate forces that move the silver price. The physical market, the actual metal moving through exchange vaults and coin shops, is one of the most misread of them. When the price falls and inventories rise at the same time, the instinct is to call it a glut. The discipline is to ask why the inventory rose. That single question separates a market that is breaking from a market that is simply catching its breath.
There are five Deep Dives in this issue of the premium Silver Catalyst newsletter, and in this article, I'll focus on one of them: the physical market.
The physical market: COMEX and London
Start with what this looks like from the outside, because the surface reading is the misleading part. When silver is genuinely scarce, two things happen. The vaults that back the futures market drain, and anyone who wants a coin in hand pays a steep premium, an extra charge above the spot price, to get one. In late May and early June, both went the other way. Warehouse stocks rose and coin premiums shrank, which on its face looks bearish, as if the shortage had broken. It had not. The price fell for monetary reasons, the same rate repricing that drove the broader selloff, and the physical market simply stopped adding any upward pull of its own. The effect was a prop removed, not a fresh leg down.
Look at why each number moved. By the June 15 report, combined silver stocks in the COMEX exchange warehouses stood at roughly 320 million ounces, with registered metal at about 85.2 million ounces, the high end of a steady build through late May and early June. Registered is the metal actually on offer to settle futures contracts; eligible is metal sitting in the same vaults but not currently for sale. The detail that matters is the source of the build. The registered pile grew because physical bars arrived and warehouses shifted metal from the eligible category into the deliverable one to meet the June delivery cycle, not because demand for the contracts dried up. That is a more durable form of easing than a statistical one. Roughly 14.1 million ounces stood for June delivery, so buyers were still taking delivery of real metal even as speculative traders trimmed their positions.
London told the same story. Vault holdings in the London market held roughly flat at 27,454 tonnes at the end of April, down just 0.1% on the month, a stabilization after the late-2025 squeeze, when holdings drained sharply and the cost to borrow silver short term, the lease rate, spiked toward 39%. The retail channel diverged hardest of all. US Mint sales of the one-ounce American Silver Eagle bullion coin fell to zero in May, and the 2026 coin traded as low as about 8.5% over spot, against the 12% to 20% premiums typical when the channel is tight. That zero was demand-driven rather than a Mint suspension, the first full-month zero since the program's launch period in the 1980s. The wholesalers who buy coins directly from the Mint held back, because ordinary buyers would not pay the current premiums and dealers were already clearing repurchased coins through discounts. The wholesale market in large good-delivery bars stayed comparatively tighter than the coin market. So the right read is a split between retail and wholesale, and a US retail step-down of roughly 2 to 4 million ounces a month, not premiums collapsing everywhere.
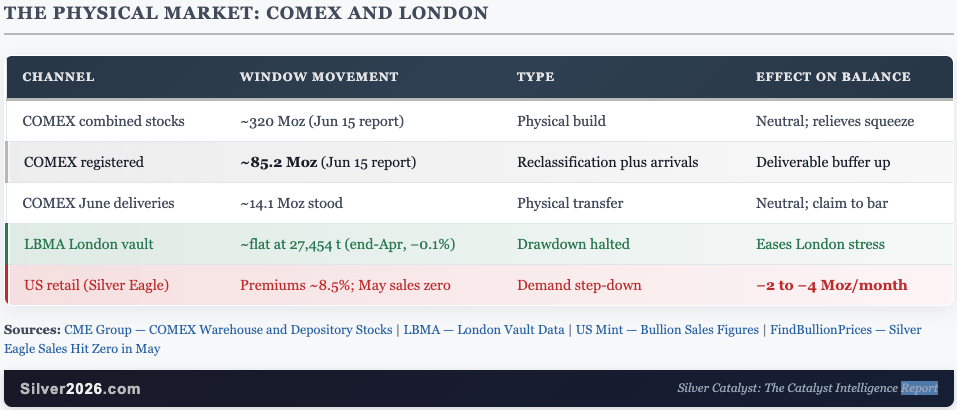
Sources: CME Group — COMEX Warehouse and Depository Stocks | LBMA — London Vault Data | US Mint — Bullion Sales Figures | FindBullionPrices — Silver Eagle Sales Hit Zero in May
What this means to Silver investors
The takeaway is to separate two things that moved together. The silver price fell because the macro turned against it, not because the world suddenly had too much metal. The vaults filled because bars arrived to settle June contracts, and the Mint sold nothing because retail buyers refused to chase premiums after a sharp drop. Both are downstream of price and sentiment. Neither touches the supply and demand balance underneath. That balance is still a deficit. 2026 is on track for a sixth consecutive annual shortfall of about 46.3 million ounces, according to Metals Focus and the Silver Institute, the same structural gap I build the case around in Silver Rising.
This is why the physical easing reads as slack rather than abundance. The metal sitting in exchange vaults is mostly spoken for or held by long-term owners, not fresh supply hunting for a buyer. The retail step-down is a few million ounces a month of demand that left on sentiment and tends to return on sentiment, often quickly once the price steadies. With the US-Iran peace framework easing the energy shock and the market pricing out the rate-hike risk that drove the selloff, silver has already bounced back toward $70. A physical market that loosened on the way down can tighten again on the way back up.
None of this changes the long arc. The longer-term case for silver still rests on a structural deficit that the physical plumbing did not resolve, and the way silver has traded throughout 2026, a round trip from a January high above $121 to the high $60s and back toward $70, is a clear illustration of how a small market amplifies swings in sentiment. The investor lesson from the physical data is simple. When the price falls and the vaults fill at the same time, ask why the metal moved before you call it a top.
Want free follow-ups to the above article and details not available to 99%+ investors? Sign up to our free newsletter today!
Author

Przemyslaw Radomski, CFA
Gold Price Forecast
Przemyslaw Radomski, CFA (PR) is a precious metals investor and analyst who takes advantage of the emotionality on the markets, and invites you to do the same. His company, Sunshine Profits, publishes analytical software that any