Geopolitics moved Gold for a day: Technicals moved it for a quarter

After yesterday’s sharp moves, not much is going on today, so I’d like to take this opportunity to step back and look at the whole arc of this war. The deal that is (probably) being signed Friday gives us a rare clean bookend, and what happened at the start of the war tells you a great deal about what is likely to happen now at its end.
Start with the single fact that frames everything. The war began on February 28 with coordinated US and Israeli strikes on Iran. It shut the Strait of Hormuz, the chokepoint for roughly a fifth of the world's oil. By any conventional reading, that is the most bullish backdrop gold could ask for: a shooting war, a closed oil artery, a dead head of state, retaliatory missiles across the Gulf. And here is what gold, silver, and the miners actually did over the three-plus months that followed.
From their early-March peaks (right after the first strike) to yesterday's close, gold fell about 20%, from $5,434.10 to $4,351.60. Silver fell about 28%, from $97.30 to $70.18. The junior and mid-tier miners, measured by the GDXJ, fell about 29%, from $157.49 to $111.88.
Metals crash in face of global crisis
A war that closed Hormuz drove the classic safe havens down by a fifth to nearly a third.
That is the entire story of this period in one line, and it is the thing most investors still cannot believe. The reason is the chain I have walked you through for months. The war did not reach gold through the safe-haven door. It reached gold through the rate door. Oil spiked, which lifted inflation, which killed the case for rate cuts and built the case for hikes, which firmed the dollar and raised real yields. Gold pays no yield, so when the cost of holding it rises, it falls, war or no war. The metals spent this entire conflict on the wrong side of that chain.
Now to the deal, and what it actually changes. I have put together a before-and-after of the conflict so you can see the net effect at a glance, who gained, who gave up, and where things stood in January versus where they stand now.
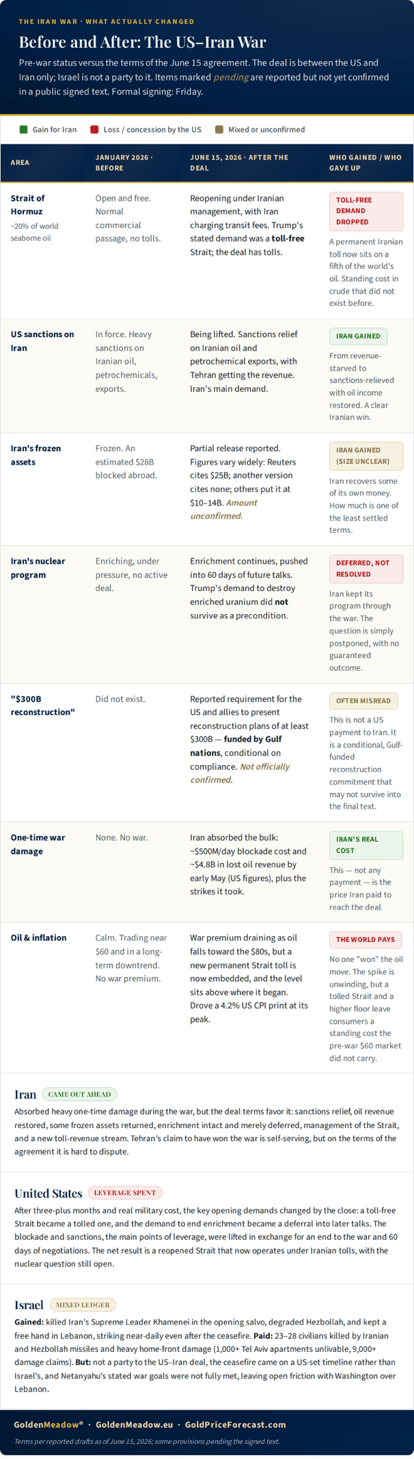
A few things stand out from that summary. The Strait reopens, but under Iranian management and with Iranian tolls, which is a permanent structural cost on a fifth of the world's oil rather than a return to the frictionless, sub-$60 crude of January. Iran gets sanctions relief and its oil revenue back, and keeps its enrichment program as a subject for later talks.
The deal is between the US and Iran only, so the Lebanon piece, which depends on Israel, is the part most likely to break. And the one figure circulating loudest, the $300 billion, is not a US payment to Iran. It is a conditional, Gulf-funded reconstruction commitment that is not even confirmed in the text. I lay all of this out because the headlines are noisy and the actual terms matter for what comes next.
Lessons from the front lines
Here is the part that ties the start of the war to its end, and it is the most important thing in this Gold Trading Alert.
When the war began, gold did exactly what the textbook said it should. It spiked - the classic safe-haven reflex. And… higher gold prices were never seen since that time.
With the war still raging, that spike gave way to a decline that ran for months. The geopolitical event moved the price for exactly one day. The interest-rate-channel and technical picture moved it for a quarter. The shock was temporary. The trend was durable.
Look at what is happening now, at the other end of the war. The peace deal broke over the weekend, and gold futures did the same thing in reverse. They spiked, popping on Sunday night and into Monday on the relief. And look at today. Gold is not extending that move. It is up only modestly. Silver is up a bit more, but nothing to write home about, either. The one-day rally on the single most de-escalatory headline of the entire war has already stopped moving higher (no new intraday highs), on the second day, the same way the one-day spike at the war's start gave way almost immediately.
That is not a coincidence. It is the same lesson twice. Geopolitical events, whether the war starting or the war ending, move this market briefly and then let go of it. What holds the price is the technical situation and the monetary backdrop, and neither of those just changed in gold's favor.
This leads to a conclusion that I think most of the market is missing. The peace being signed Friday is, by every account, close to the best case. A complete deal, the Strait reopening, the war over. The market has spent the previous session and today’s pre-market trading pricing exactly that. And when the best case is fully priced, the surprises from there can only run one way.
For gold to fall further on the deal, something even more peaceful than "complete peace" would have to arrive, and there is no such thing. But the list of things that could disappoint is long, starting with the following:
- the signing could slip on Friday the way every prior deadline has slipped
- Israel could reignite Lebanon
- Iran could slow-walk the thirty days it has to actually reopen the Strait
Or, most simply, nothing new could happen at all. And if nothing happens, the market's attention turns back to what it was ignoring, a 4.2% inflation rate and a Federal Reserve that has not eased.
And the timing of what comes next could not be sharper, because the catalyst is no longer geopolitical. With the war (possibly) clearing, the entire question for gold comes down to the Federal Reserve, and Warsh chairs his first meeting tomorrow. The rate decision itself is not the event, a hold is all but certain. The event is the tone and the projections, and there is a specific asymmetry worth understanding. The market has come to expect Warsh to lean dovish, helped along by the deal and falling oil. When expectations are set that high, even a neutral, data-dependent message can read as hawkish by comparison, and hawkish is what pressures the metals. So, the bar for Warsh to satisfy a market positioned for dovishness is high, and the risk is that he disappoints it.
Put the whole picture together and it resolves cleanly. A war that should have launched gold instead saw it fall 20% while the war raged, because the real driver was rates, not fear. That same war is now ending, and the relief rally is already fading on its second day, exactly as the opening spike faded on its second day. The peace is priced, and not even signed, so the surprises skew lower. And the catalyst that actually moves this market, the Fed, sits one day away with the burden of proof on the dovish case. I think the short-term bounce is a bounce, not a turn, and that once these geopolitical events finish moving the price the way they always do, briefly, the market is likely to go where the technical and monetary situation points it. That direction has been down for three months, and nothing in this deal has changed it.
Crude, Dollar, and Gold at critical junctures
The full version of today’s analysis includes analysis of multiple markets, including silver, mining stocks, copper along with key trading details, but in today’s free article, I’m going to provide my comments on three markets” crude oil, USD Index, and gold.
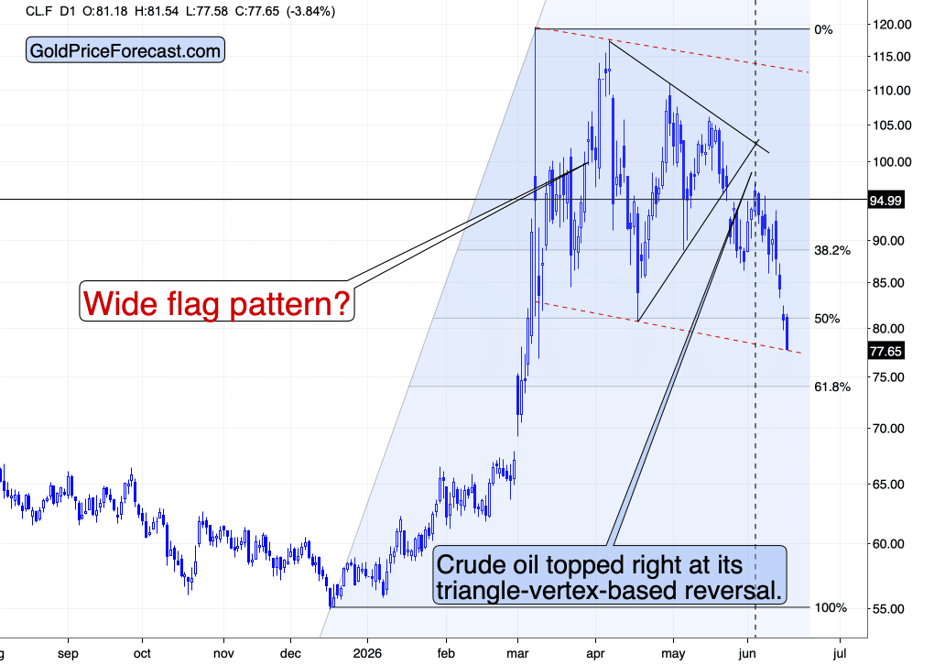
Crude oil touched the lower border of the trend channel. A confirmed breakdown below it would imply that a broad top, and not a consolidation, is in. So far we haven’t seen it and the jury remains out. Similarly to the signature on the peace deal.
Please note that crude oil topped exactly at its triangle-vertex-based reversal – please remember that for the upcoming times when you read that technicals no longer work on the markets because we are in “different times”. They were working and they will be working in the future as they are based on investors’ emotions – and those won’t change regardless of geopolitics or economic growth.
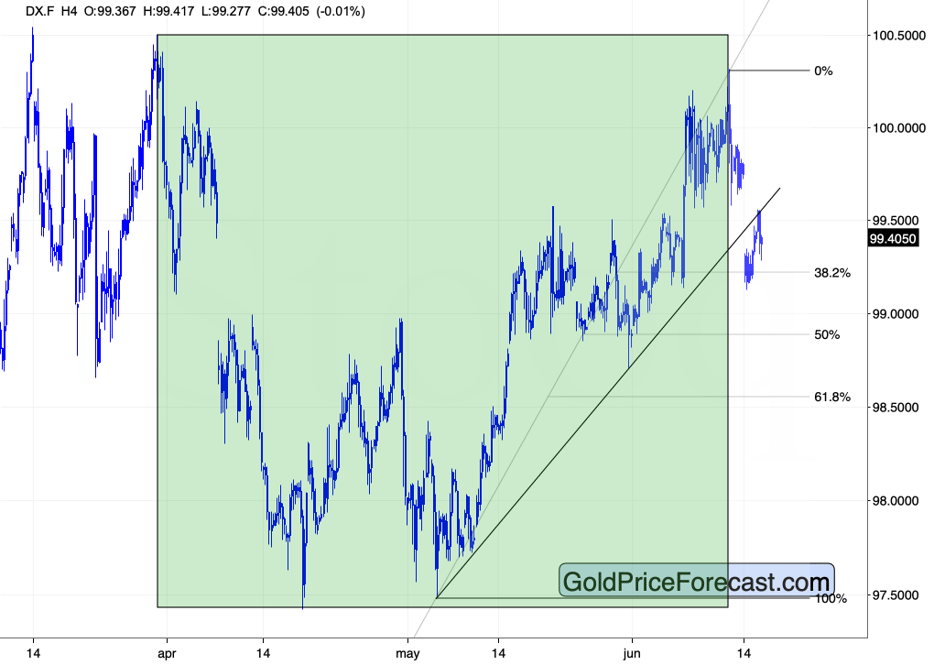
The USD Index could be verifying its breakdown below the rising support line, or it could be on a verge of invalidating it. It seems that we’ll know after tomorrow’s Fed’s press conference.
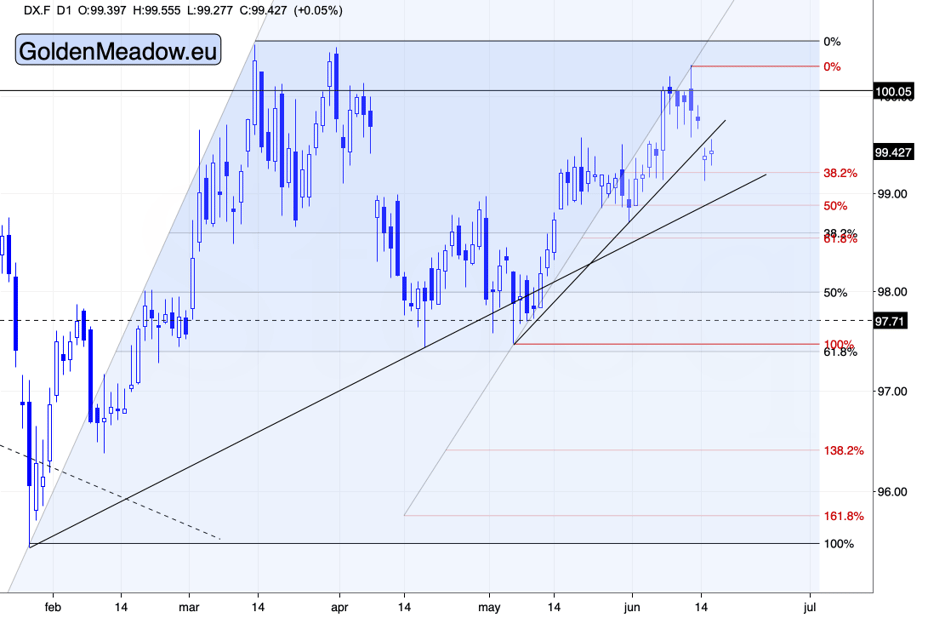
My yesterday’s comments on the above chart remain up-to-date:
The USD Index declined strongly, but… If we zoom out, it turns out that it’s not that much of a game-changer.
The USD Index has only reached the first of the classic Fibonacci retracement support levels – the 38.2% one – based on the May-June rally. This means that even the short-term uptrend remains intact.
And even if the USD moves lower by about 0.3 from here, there’s the 50% retracement there, the late-May lows, and the rising support line based on the January and April lows.
During Friday’s subscriber-exclusive webinar, I spoke about the possible cup-and-handle formation in the USD Index. The March-June cup remains intact. The current move down might simply be the “handle” in the making.
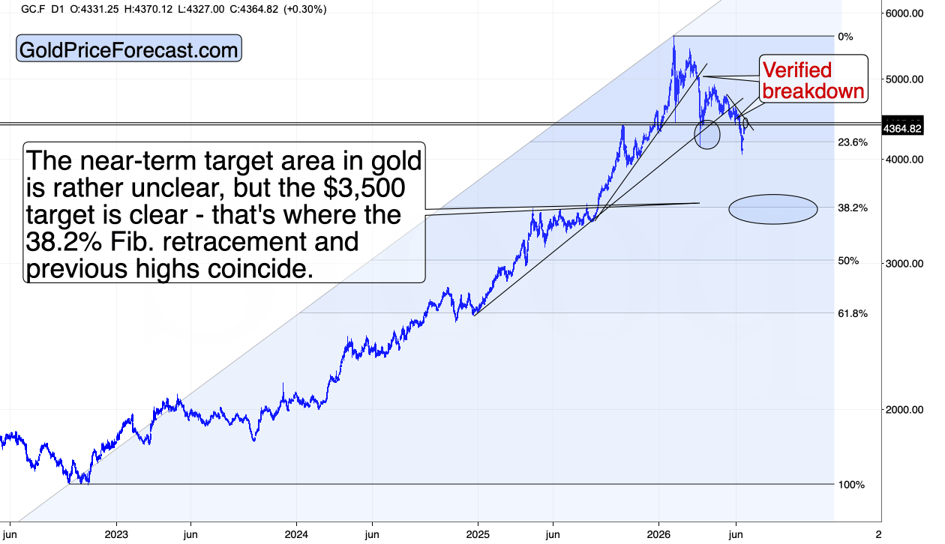
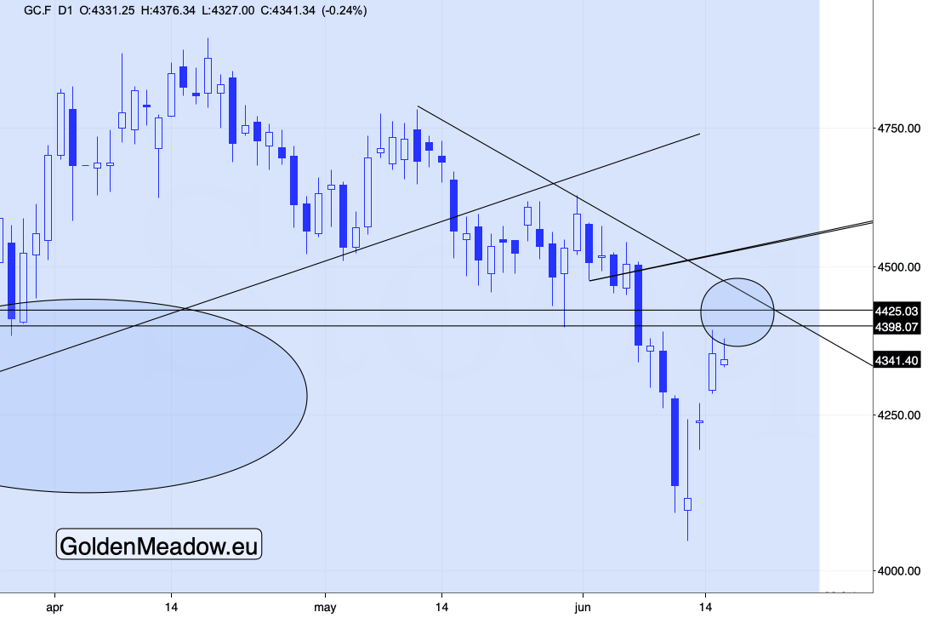
Gold is pretty much at the lower border of its target area. This might be the top, or we might move slightly higher before the rally reverses.
In the June 9 Gold Trading Alert, I featured a downside target for gold at $4,000 - $4,200. It bottomed at $4,046.20. However, what started now is likely a counter-trend rebound, not the start of a new big rally.
Please note that gold futures did NOT manage to move to new intraday highs today. The link to the first session after the daily rally back in March remains fully intact.
The outlook remains bearish and it seems that the next big move will be to the downside.
Want free follow-ups to the above article and details not available to 99%+ investors? Sign up to our free newsletter today!
Author

Przemyslaw Radomski, CFA
Gold Price Forecast
Przemyslaw Radomski, CFA (PR) is a precious metals investor and analyst who takes advantage of the emotionality on the markets, and invites you to do the same. His company, Sunshine Profits, publishes analytical software that any