If it’s so great (Stocks, Gold), why is it so bad (Consumer Sentiment Index)?

The breather in PMs and miners was likely (as I wrote yesterday). The breather was natural. And the breather is probably over.
And it is not the point of today’s free analysis to discuss the very short-term events (I’m doing this in today’s Alert), but rather to provide you with a through update on several charts that usually get very little coverage, and that currently have one common – the year 2008.
Enter the world stocks chart.
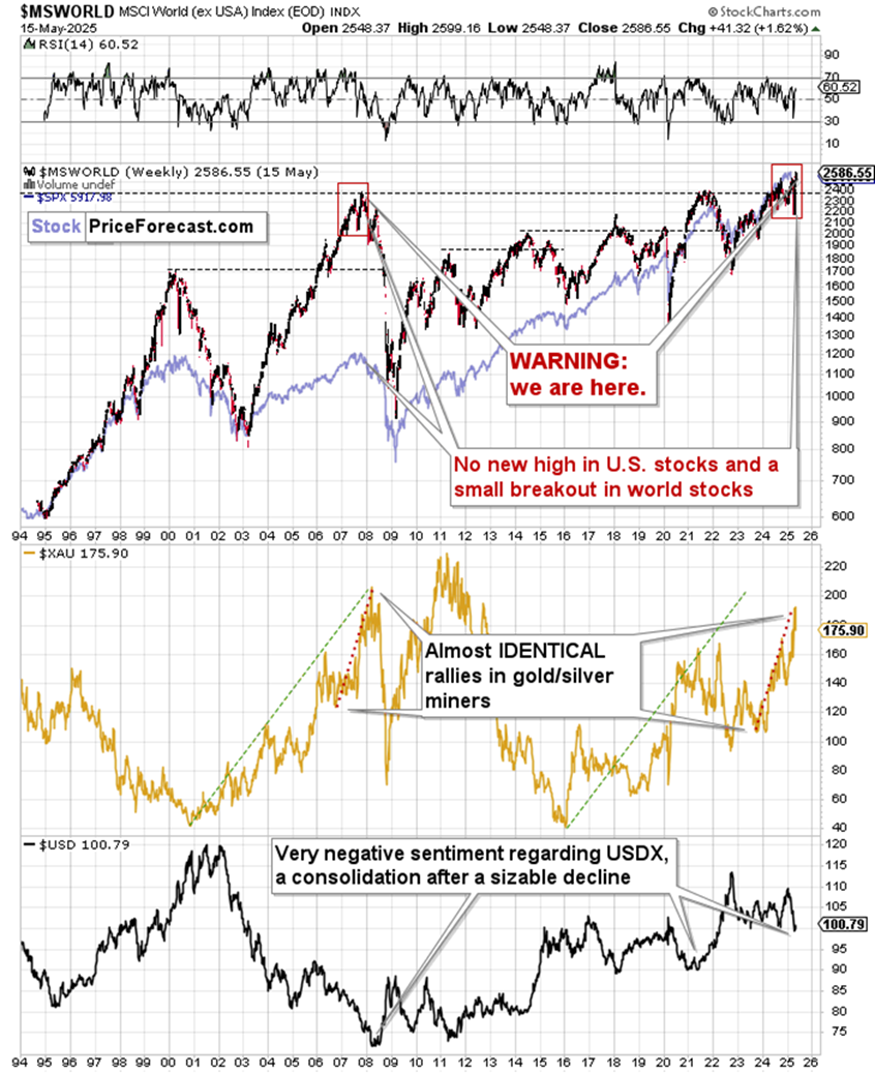
The index featured on the above chart includes all key stock markets, but without the U.S. stock market, while the U.S. stock market is presented in light blue, in the background.
I had previously thought that this year’s first top in world stocks was the final top, and I had – incorrectly – assumed that the declines would have started after that time – also in the mining stocks. That wasn’t the case, but it doesn’t mean that the entire comparison to 2008 was useless. It simply means that what I saw then wasn’t the correct link and that something else might be the correct one.
On a side note, please keep in mind that not being correct in all cases is the part of this profession, and the only ones that always pick each and every top and bottom on the market are liars.
So… What’s actually going on? Most likely a different kind of analogy is taking place. When I look at the above chart now, it seems quite clear, but again, it’s easy to say with the benefit of hindsight.
Familiar signs of a market top
Anyway, what we have now is a rally to new highs in world stocks without an analogous rally in the U.S. stocks. We also see that this breakout in world stocks happened after a sharp decline. Moreover, there was a sizable rally in mining stocks (XAU Index in the middle part of the chart), which ended when the USD Index formed its major bottom.
All details from the previous paragraph apply to the 2008 top in world stocks / U.S. stocks and mining stocks as well. Even the double-top in the U.S. stocks – and in particular, the fact that world stocks outperformed U.S. stocks right at the top.
Why would this be the case?
Those of you who’ve been following my analyses for some time know that there’s a specific phenomenon on the markets called laggard’s catch-up. Weaker markets gain second wind right before the top as the investment public buys what’s cheap without considering that it might be cheap for a reason. We see this on a smaller scale and within sectors, but the same rule applies also to the broad markets. In the previous years, U.S. stocks outperformed other stock markets, so those other stock markets are the laggards. They just outperformed – exactly like they did in 2008 at their top.
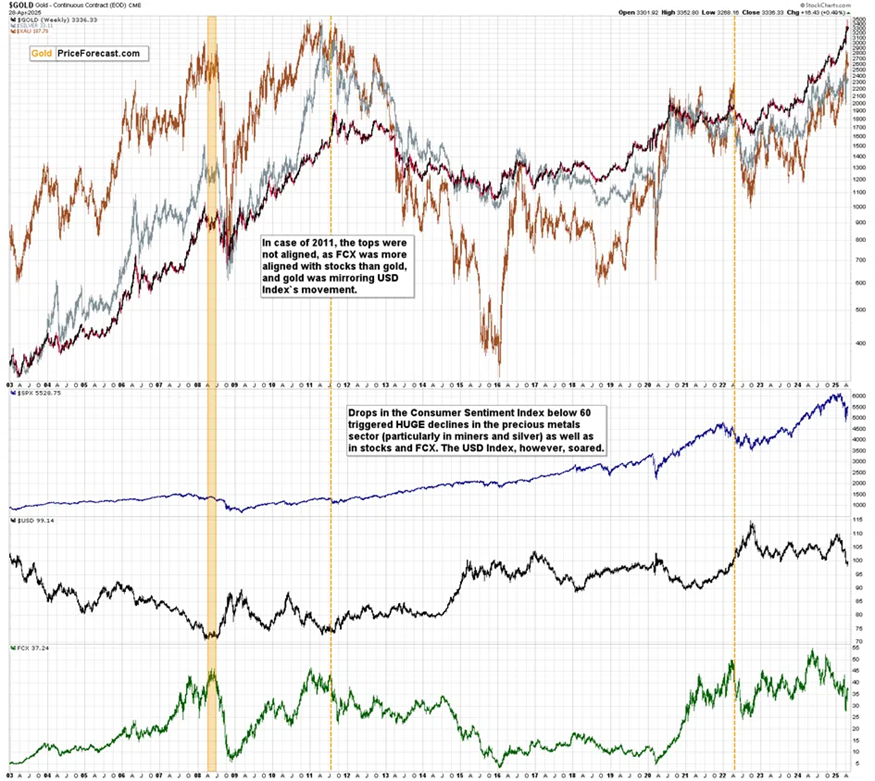
And if that wasn’t enough, mining stocks themselves provide very interesting analogies as well. Please compare the sizes of the entire bull markets in the XAU Index that started in 2000 and 2016. I marked them with green lines. They are very similar. This time, the rally took longer, and it was a bit smaller, but overall, they are quite remarkably similar given how many years passed between them and how the world changed in the meantime.
What’s even more profound is the link between the final part of each upswing that I marked with red lines.
Plus, on top of all that, we have a major bottom in the USD Index that was confirmed by an extremely negative sentiment despite an improved fundamental outlook (tariffs are fundamentally bullish for the USD, so “logically” USDX should be higher than it was before April, not lower).
Also, Consumer Sentiment Index just moved even lower this month, which further confirms how extreme the situation has become.
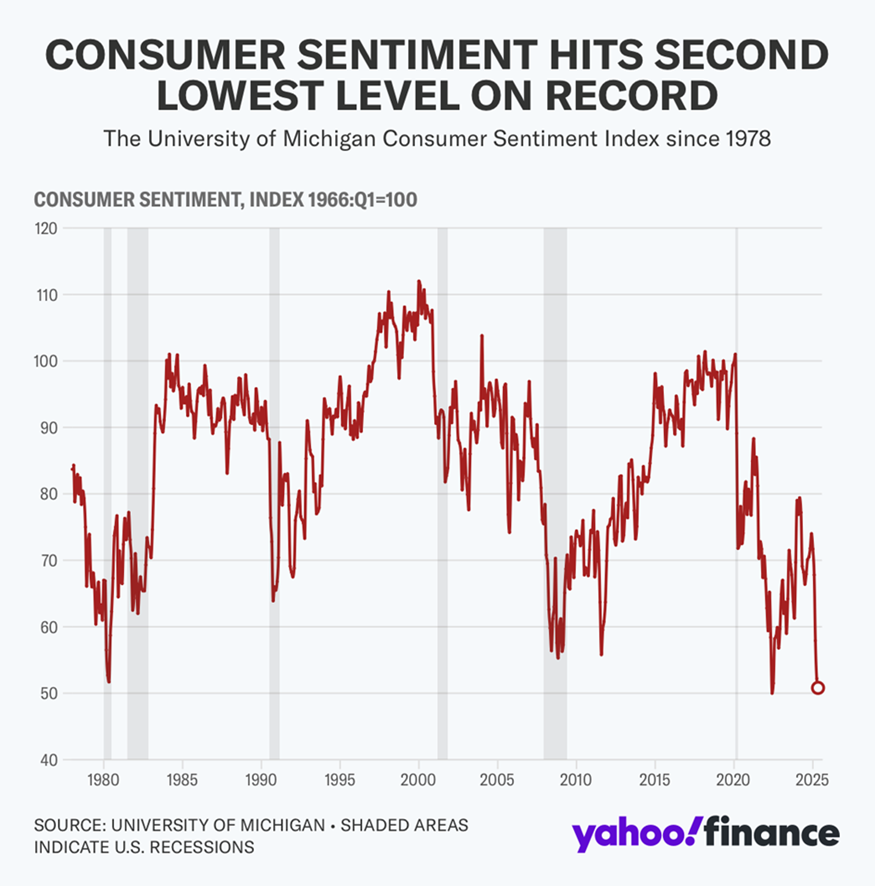
I already wrote about that last month and you can read the full analysis using the above link, but as a quick reminder, I’m pasting the chart below to show you what kind of price action followed after previous extreme lows in that index. And it ain’t pretty.
That’s yet another link to 2008.
At this point you might be wondering… What does all this have to do with silver (no, those with silver in their retirement accounts will likely not be affected as they are likely to cash in their proceeds in many years)?
Quite a lot.
That’s when the price of the white precious metal plunged. The same happened with copper, crude oil, mining stocks (and yes, FCX, plunged even more).
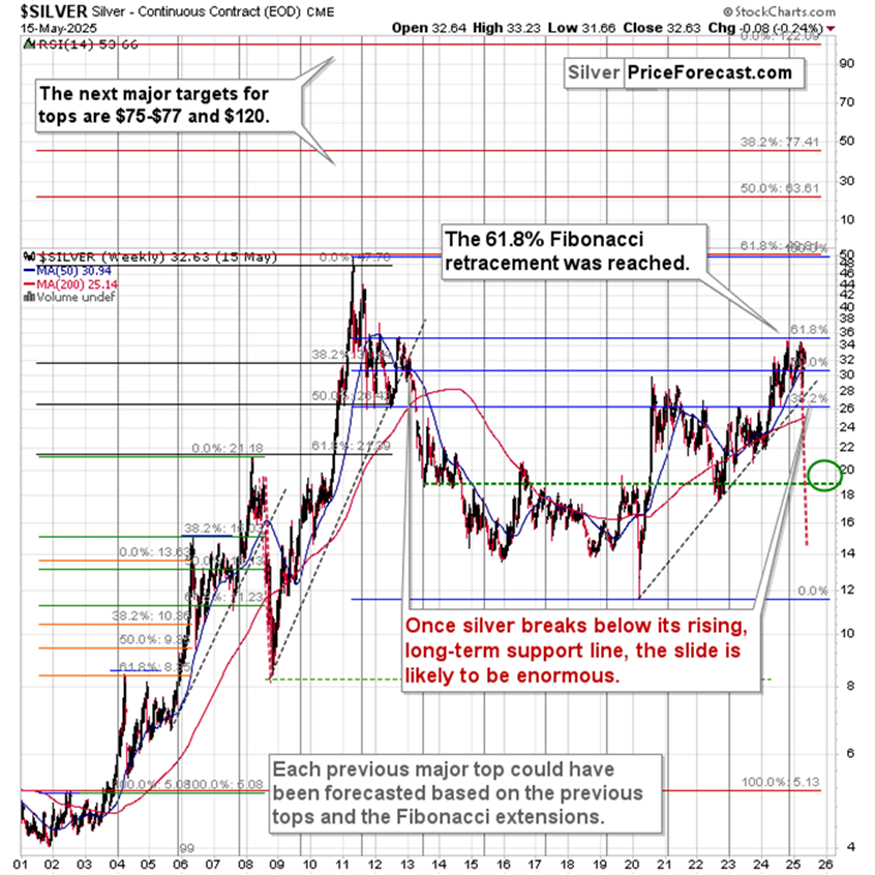
The thing that I would like to stress here is that when silver breaks below its rising dashed support line (currently at about $28), it will be difficult to stop the decline. Yes, there are some interim targets, like the 2022 low and the $20 level, but from the medium-term point of view, silver can really decline below $20, and perhaps even below $15 before this is all over.
If things get really ugly, I wouldn’t even be surprised by a move to the 2020 lows. Why would this be the case? Because on one hand we have a fundamentals-driven decline ahead of us (link to 2008), and on the other hand we have gold that’s after a top that’s similar to what we saw in 2011. Plus, stocks are probably topping while being very overbought and the USD Index already formed a major, medium-term bottom.
This is a very powerful combination of long-term factors that should not be ignored.
Now, of course, silver will not get that low in a straight line, and there will likely be short-term corrections along the way, which we might want to trade, but at this moment, the next direction for silver is quite clear – and it’s down.
2011 pattern may be repeating
Speaking of gold’s link to 2011, I’d like to show you something before wrapping it up for today.
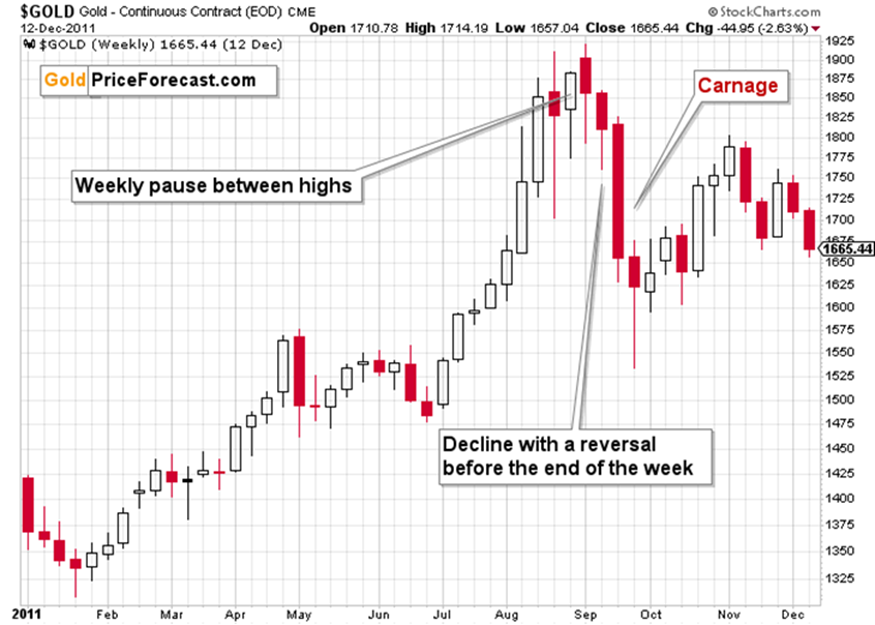
Back in 2011, there was a weekly pause between the two tops, and then, after the second top there was a weekly decline with a reversal. The huge slide materialized in the week that followed.
Well…

There was a weekly pause between the recent highs, and this week we see a weekly decline with a reversal.
While the history doesn’t have to repeat itself to the letter, I wouldn’t want to be holding speculative long positions here…
I wanted to write a shorter analysis today, but there’s just too much interesting things happening that I want to share with you for me to keep it short. I really want you to be up-to-date with all those things, as this might impact your investment decisions.
So, one last thing – the searches for the “gold price” phrase. I wrote about it previously (that it’s a good indication of interest in gold in general) and I think it’s worth re-stating those points as their implications remain very much intact. (Yes, searches for gold and silver IRA investments near me are also high)
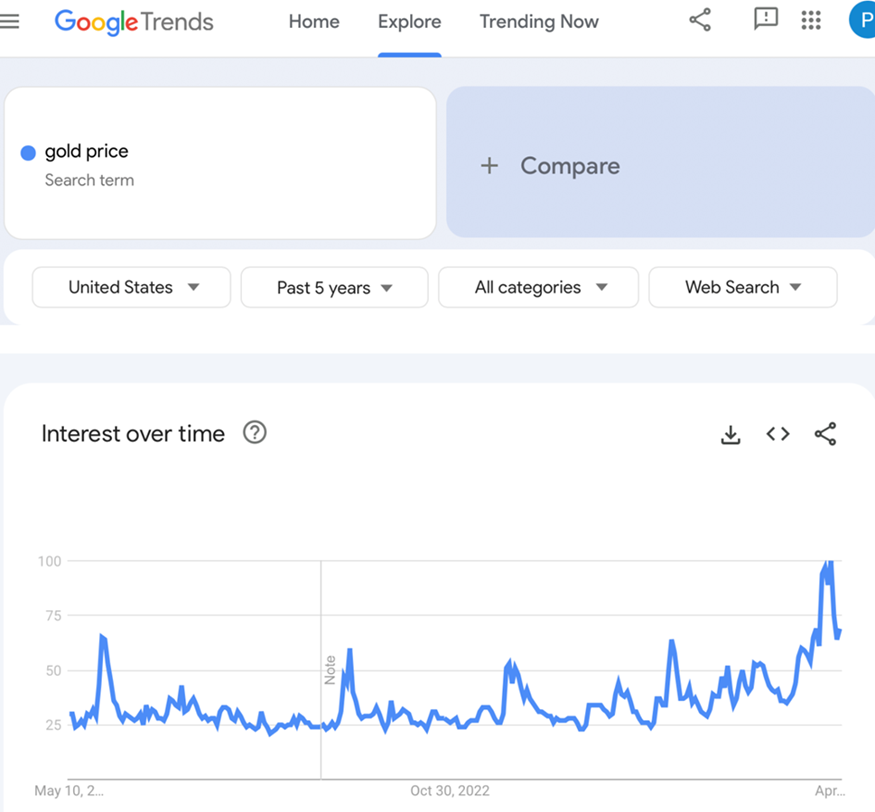
The searches obviously peaked recently, and the interest was exceptionally high. Let’s see what happened in the previous cases when that happened.
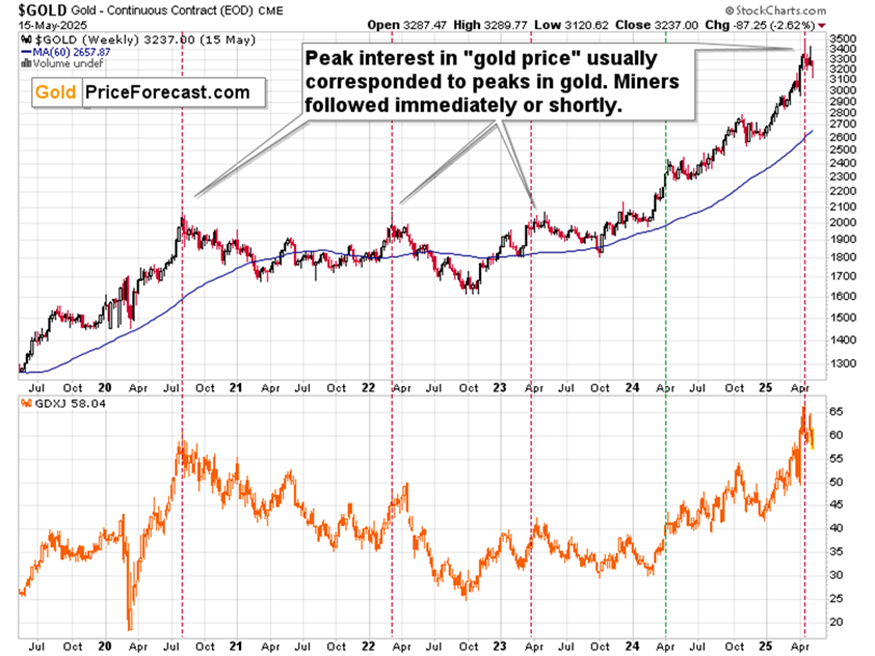
Gold and mining stocks topped!
I previously wrote about that when GDXJ was above $63, and I emphasized how bearish the implications were.
The GDXJ declined since that time, but compared to how much it declined after the previous (less significant) sentiment peaks, it’s clear that the declines are just getting started.
Want free follow-ups to the above article and details not available to 99%+ investors? Sign up to our free newsletter today!
Want free follow-ups to the above article and details not available to 99%+ investors? Sign up to our free newsletter today!
Author

Przemyslaw Radomski, CFA
Sunshine Profits
Przemyslaw Radomski, CFA (PR) is a precious metals investor and analyst who takes advantage of the emotionality on the markets, and invites you to do the same. His company, Sunshine Profits, publishes analytical software that any


