Historic Transaction in Bullion Industry. Will It Transform Gold Market?

What a deal! Newmont Mining will buy rival Goldcorp, creating the world’s largest gold miner. What does it mean for the gold market?
New Wave of M&A in the Bullion Industry
Just a few weeks ago, Barrick Gold merged with Randgold Resources. The $18.3 billion-deal has created a sector-leading miner owning top gold mines and the largest reserve base among its peers. Initially, the new company had a market capitalization of more than $23.75 billion.
Before the dust fell, another news shook the bullion industry. Just a few days ago, it was revealed that Newmont Mining would be buying Goldcorp in a massive $10 billion deal. The resultant company will be the world’s largest gold producer by number of ounces mined (about 8 million ounces annually), larger even than “New Barrick” (about 6.6 million ounces per year).
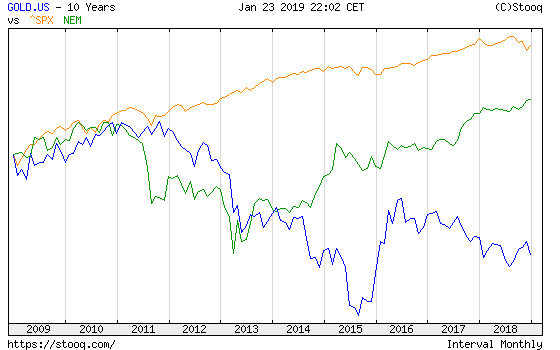
These two deals may be just the start of a big shake-up in the bullion industry. After all, the sector desperately needs consolidation. Lackluster bullion prices hit the miners’ profitability in the last few years, pushing gold mining out of favor for many investors. A new wave of mergers and acquisitions could, thus, reduce costs and bring profitability back to the gold mining sector. Hence, if we see a smart consolidation, mining stocks can go up. Given the very low valuations relative to the S&P 500 (see the chart below, which compares the market value of New Barrick with Newmont and the general stock market index), it might be a buying opportunity (however, it’s not easy to invest in mining stocks, picking the right mining stock, etc.).
Chart 1: New Barrick’s market value (blue line), Newmont’s market value (green line) and the S&P 500 (orange line) over the last ten years.
Implications for Gold
What does the new wave of M&A in the bullion industry imply for gold? Not so much, at least not directly. The consolidation may improve the situation of the sector, but it will not affect the gold prices, set in the international markets in London and New York. Gold production costs may fall, but gold bulls should not worry – costs do not drive prices. It works the other way around – the lackluster gold prices have finally pushed gold producers towards consolidation, whose purpose is to reduce costs and boost productivity.
However, there might be an indirect positive effect. What we mean here is that the improved valuations of gold stocks may spur some interest in gold. Gold mining was out of favor for several years. Any positive changes could, thus, create positive sentiment toward the whole gold market.
Having said that, we do not believe that this effect will be strong. If at all, there will be a reverse link, i.e. a stronger interest in gold as an asset class may trigger more positive sentiment toward companies which mine bullion. You see, the consolidation in the bullion industry usually occurs around gold bottoms. The last big wave of M&A took place in the late 1990s, just at the end of the bear market in gold, which was obviously a tough period for the mining industry. Just as a reminder, gold bottomed at $253 in 1999, as one can see in the chart below.
Chart 2: Gold prices (London P.M. Fix) from January 1996 to January 2019.
-636839465480470732.png)
Now, the situation is somewhat similar. After the sharp fall in gold prices in 2013, gold prices were trading sideways around $1,200, a level lower or only slightly higher than total gold production costs. In other words, the recent wave of M&A suggests that gold may be bottoming.
The current macroeconomic outlook – i.e., the economic slowdown both in China and the U.S. and the pause in the Fed’s monetary tightening – is also favorable for gold. If the greenback enters the bear market, gold should rally. Will that happen? We will see. Today the ECB holds its monetary policy meeting, while the FOMC gathers next week. These events might be key for the gold market this year. Stay tuned!
Want free follow-ups to the above article and details not available to 99%+ investors? Sign up to our free newsletter today!
Author

Arkadiusz Sieroń
Gold Price Forecast
Arkadiusz Sieroń received his Ph.D. in economics in 2016 (his doctoral thesis was about Cantillon effects), and has been an assistant professor at the Institute of Economic Sciences at the University of Wrocław since 2017.