Higher To Go?

Market Overview
“Friday’s price action showed some reluctance to move lower aggressively, and this resulted in some minor positive divergence developing in the hourly as well as the daily chart. The price pattern that we are making suggests that the decline is ready to take a breather and it would fit in with our expectation that a cycle is bottoming.”
This is what was written last week in my daily chart analysis of the SPX. At the time, if we did reverse, there was a potential move to 2850 before the counter-trend rally concluded. This has been exceeded by a good margin and, since there is no real warning that the rally is over, we need to wait until the signs that we are putting an end to it appear. Another reason for expecting an imminent low to be made was the fact that we were approaching the ending phase of the 45-td cycle
In spite of this renewed market strength, another decline to a level lower than the recent low of 2728.81 is expected as we move closer to the time frame previously stated for the larger C-wave to come to an end. It is still several weeks/months away. As to whether or not the 2346 December low will be exceeded, we have to put that on the back burner until the structure of wave IV becomes more defined.
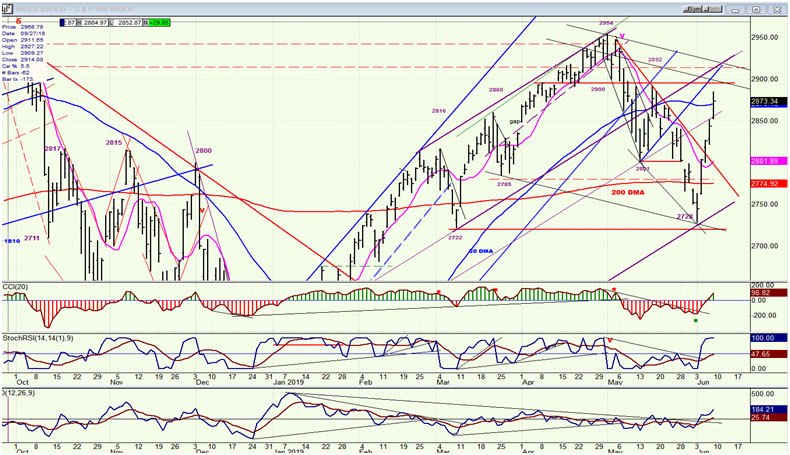
SPX daily chart
After a decline of 226 points, the bulls had had enough!Their decision to regroup and mount a counter-offensive was more visible on the hourly chart than on the daily (as stated above in the quote from last week’s letter). Butthat they had this much energy stored up was not visible at the time, and it does not look as if it has completely run out. So how much higher are we going with this? According to the P&F chart, a tentative count to 2910-2940 is a possibility. The Fibonacci retracement of .618 has already been exceeded, and we have almost reached 2888 which would be a retracement of 70.7%. In other words, trying to put a number on the rally high would be a guessing game and we’ll have to simply wait for signs that we are ready to reverse, imperceptible as they might be -- as with the recent low. With no real deceleration in sight, and with all three oscillators still in an uptrend, odds favor higher prices, perhaps until they meet resistance in the vicinity of 2900+ which is designated on the chart asthe juncture of various important parallels.
On Friday, after running into the last downtrend line from the top (next chart), the index had its second shallow correction of the counter-trend rally --countertrend, because I am of the opinion that, in spite of all the strength displayed, we are still in the middle of a corrective pattern which is not complete. However, the fact that the preceding decline did not continue below the 2722 does affect the overall structure of wave IV. One EWT analyst (at least) is looking at the current pattern developing into a potential flat which still has the C-wave to go before completion(after the current B-wave has ended).
While many bulls may be of the opinion that the correction is over, there are at least two components of the general market which strongly disagree: IWM and TRAN. Both of these have leadership properties which necessitate their inclusion in a total market analysis. As we will see later, the first is still a notable laggard in the overall market action, and the second is even weaker! Until they show better performance relative to the other benchmark indexes, one cannot not turn bullish about the market action.
SPX hourly chart
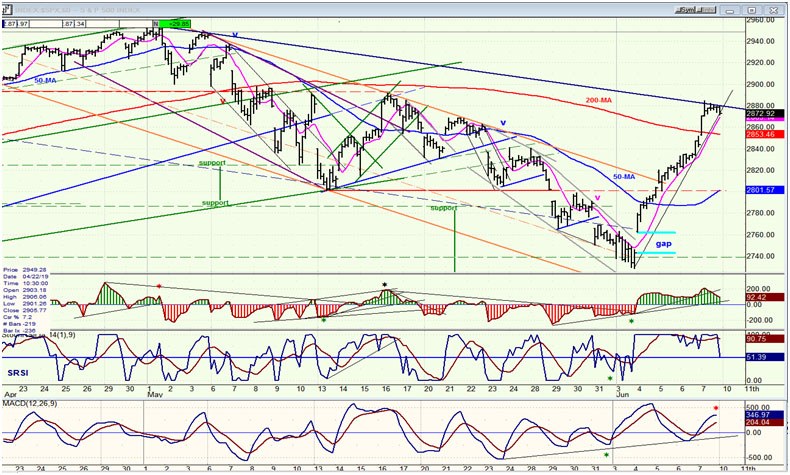
Friday’s extension of the uptrend stopped at the last downtrend line from the top, creating a brief halt on the steep trend line and just above the 9-ma. In other words, the rally has not even created the minimum requirement for a potential reversal. At best, this halt caused the two top oscillators to turn down and the A/D indicator to show some negative divergence, but all remain positive and would have to continue lower to give a sell signal. Even if the 60m chart indicators did give us a sell signal, it would have to be considered only preliminary until the daily oscillators turn negative.
One clue that the index has started a downtrend will be given by the blue 50-hr ma. As you can see on the chart, the two times that it was decisively penetrated on the downside prices continued to fall, afterwards. Due to its present lack of proximity to that MA, I suspect that it will be some time before SPX turns bearish.
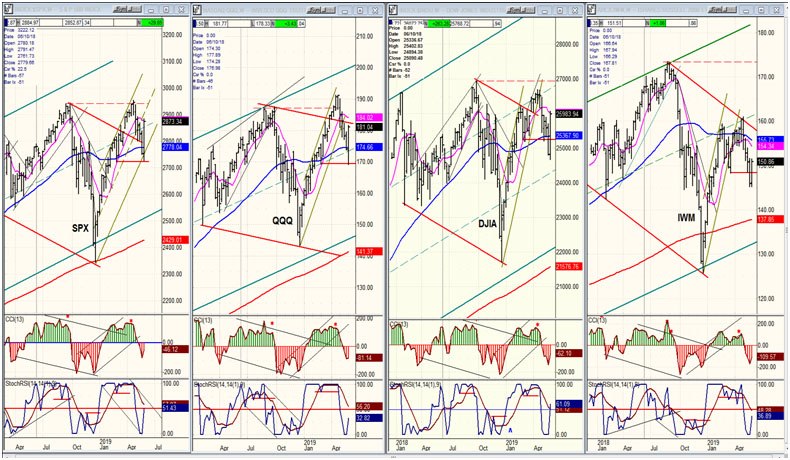
QQQ, SPX, DJIA, IWM (weekly)
Last week, SPX and QQQ traded places as the latter had a severe selling bout which was followed by a good recovery; but not enough to keep it in first place. Of greater importance, IWM remains firmly entrenched in last place, providing plenty of skepticism concerning the bullish nature of this rally.
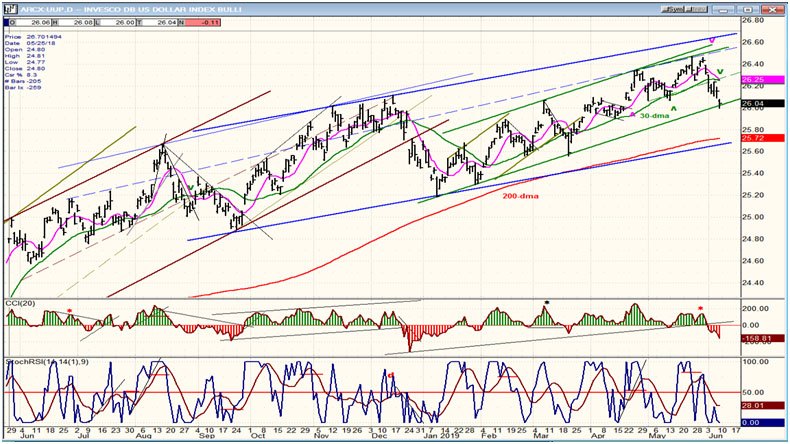
UUP (dollar ETF)
When UUP made a new high and reversed immediately two weeks ago, I suggested that (as it did previously)it would follow with a move to the bottom of the green channel. It has, but there is a difference this time! The move started below the top of the channel, suggesting that this minor decline has a good chance of expanding into something more severe; perhaps continuing all the way down to the bottom of the larger, blue channel and to the 200-dma. But first, there might be a feeble attempt at holding the current level.
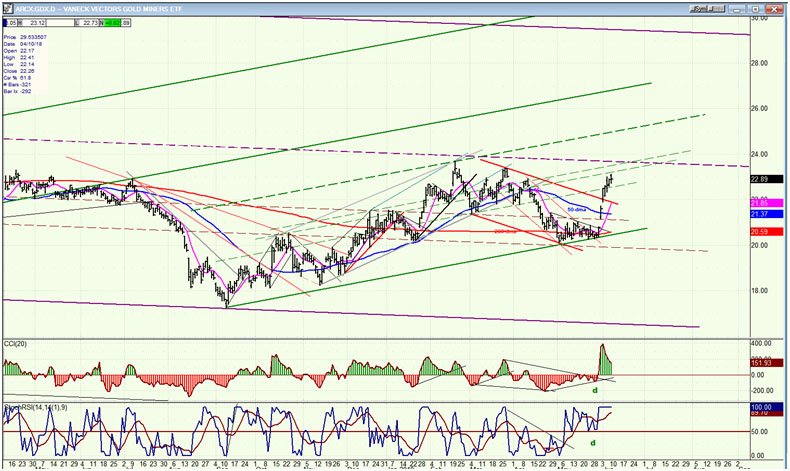
GDX (Gold miners ETF) daily
I made this chart more narrow because I wanted to show the top of the purple channel which is where I think GDX has a least a good chance of heading over the next few weeks. Without much more consolidation at its current level, it may rise to the 25-25.50 area, which is what the P&F chart is suggesting. However, if the larger P&F base is considered, this move could expand to 34-35;although the index will have to jump through a few hoops to get there, including getting past the top line of the purple channel. For now, it has a good start. Let’s see how it follows through.
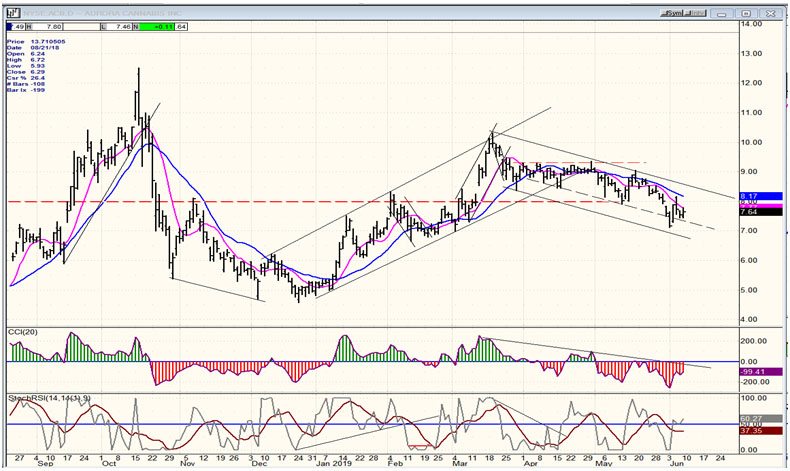
ACB (Aurora Cannabis) daily
ACB has not responded to the buying frenzy, which means that it is detached from the general market action and will respond positively only when the prospects for the Cannabis industry (or those of the company) brighten. For now, the downtrend still looks like a correction which is trying to find support at the 50% retracement of its previous uptrend. .618 is around 6.75. Let’s give it a little more time.
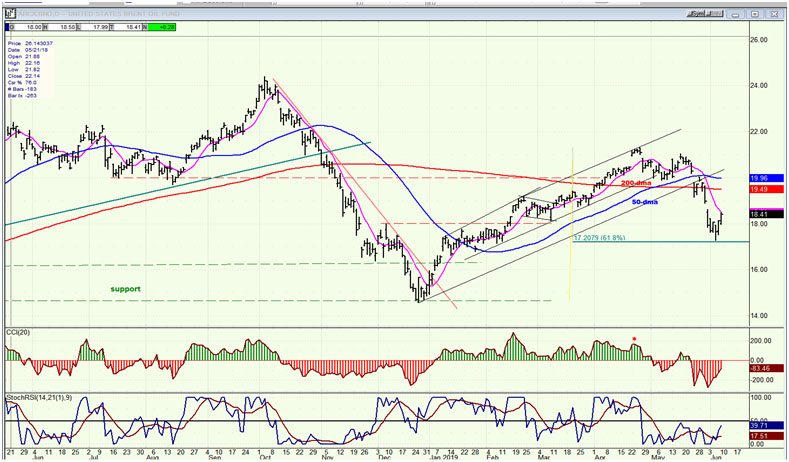
BNO (U.S. Brent oil fund) daily
BNO found support at its .618 retracement level and has rallied. But it is also not keeping pace with the general market. It must be given more time to create a larger base, which is what it appears to need after declining from a high of 46 to a low of 8.80.
Summary
“Last week, SPX made a new low in the downtrend which started at 2954. It should be just about ready for another rally, but ideally not before it reaches ~2715 -- in spite of positive divergence beginning to appear in the hourly indicators, and the probability that we are near the low of a 45-d cycle which could bring a reversal at any time.”
That cycle is at least partially responsible for the current rally. Many factors go into the structural patterns that are made by the market over an intermediate time frame. Cycles are part of the whole. In spite of the current rallying strength, I am still of the opinion that we are only halfway through the entire correction which should last until August-September.
Author

Andre Gratian
Market Turning Points
When I was a stock broker years ago, a friend introduced me to technical analysis of the market and it is not an exaggeration to say that I fell in love with this approach! Ever since then, it has become an increasingly important


