Has S&P E-Mini Futures (ES_F) Formed Secondary High?
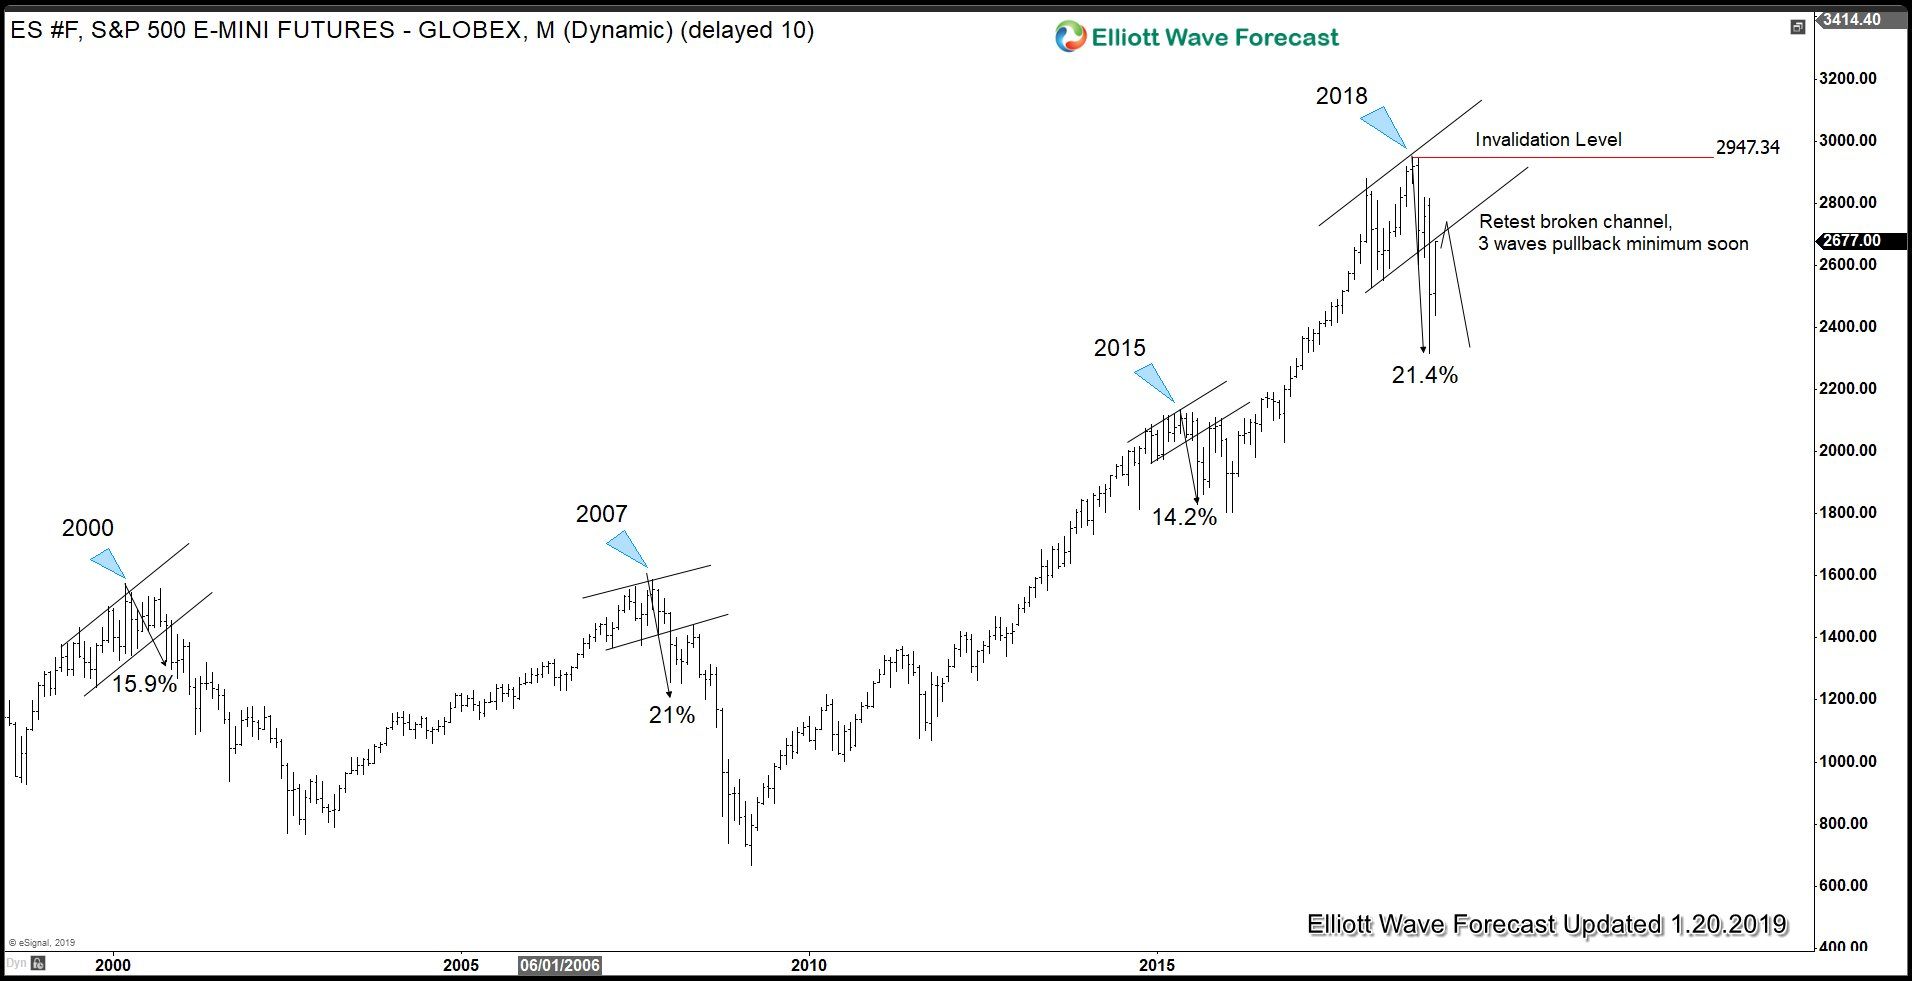
Recall in our previous article we said U.S. Indices, specifically S&P 500 E-Mini Futures (ES_F), likely won’t break last year’s high yet. From the technical side, the chart below shows why the current level around 2700 presents a formidable resistance.
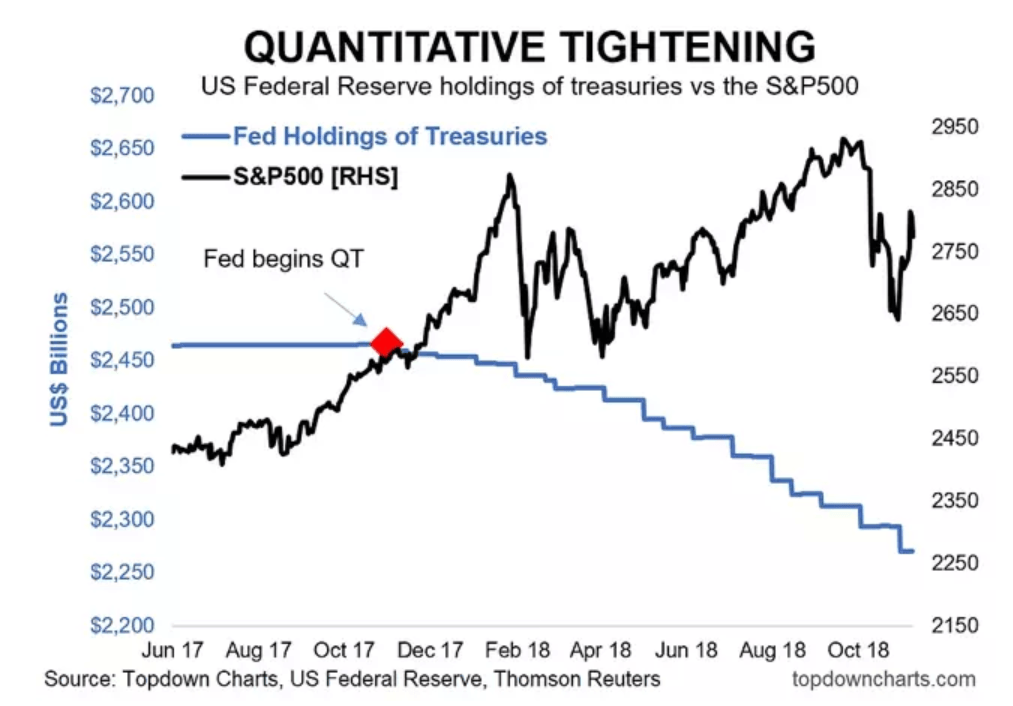
From the fundamental side, we have a slew of headwinds which can impede the current rally. The Fed still remains in quantitative tightening (QT) mode to normalize its balance sheet. The Fed is now at the maximum pace of $50B tightening per month. If QE (Quantitative Easing) is a tailwind for stocks, then logically QT should be a headwind for stocks. As the flow of QT increases to maximum pace, the pressure and volatility in the stock market can also start to increase.
Then there’s the risk of U.S and China’s trade war. Both countries have slapped tariffs against each other’s goods since last year. Although both sides remain in negotiation, failure to reach a settlement by March deadline can see US increases the tariffs on $200 billion worth of Chinese goods from 10% to 25%. Deep divisions on both sides remain on the issues of intellectual property and forced technology transfer. A research by Washington-based consultancy Trade Partnership Worldwide suggests almost 1 million American jobs are at risk with the current trade war with China and other countries. In addition, should US push ahead and increase tariffs to 25% to Chinese goods, the same study predicts more than 2 million American jobs can be affected.
Last but not least, there’s also a threat of another U.S. partial government shutdown due to Trump’s wall funding issue. The White House had asked for $5.7 billion, and the Democratic-controlled House rejected it. The White House said it has not ruled out another federal government shutdown this Friday if they still can’t reach a deal by then. Congressional Budget Office (CBO) said the last 5 week shutdown will make the US economy 0.02% smaller in 2019. If another extended shutdown happens, it will further affect the US economy.
ES_F 4 Hour chart 10 February 2019
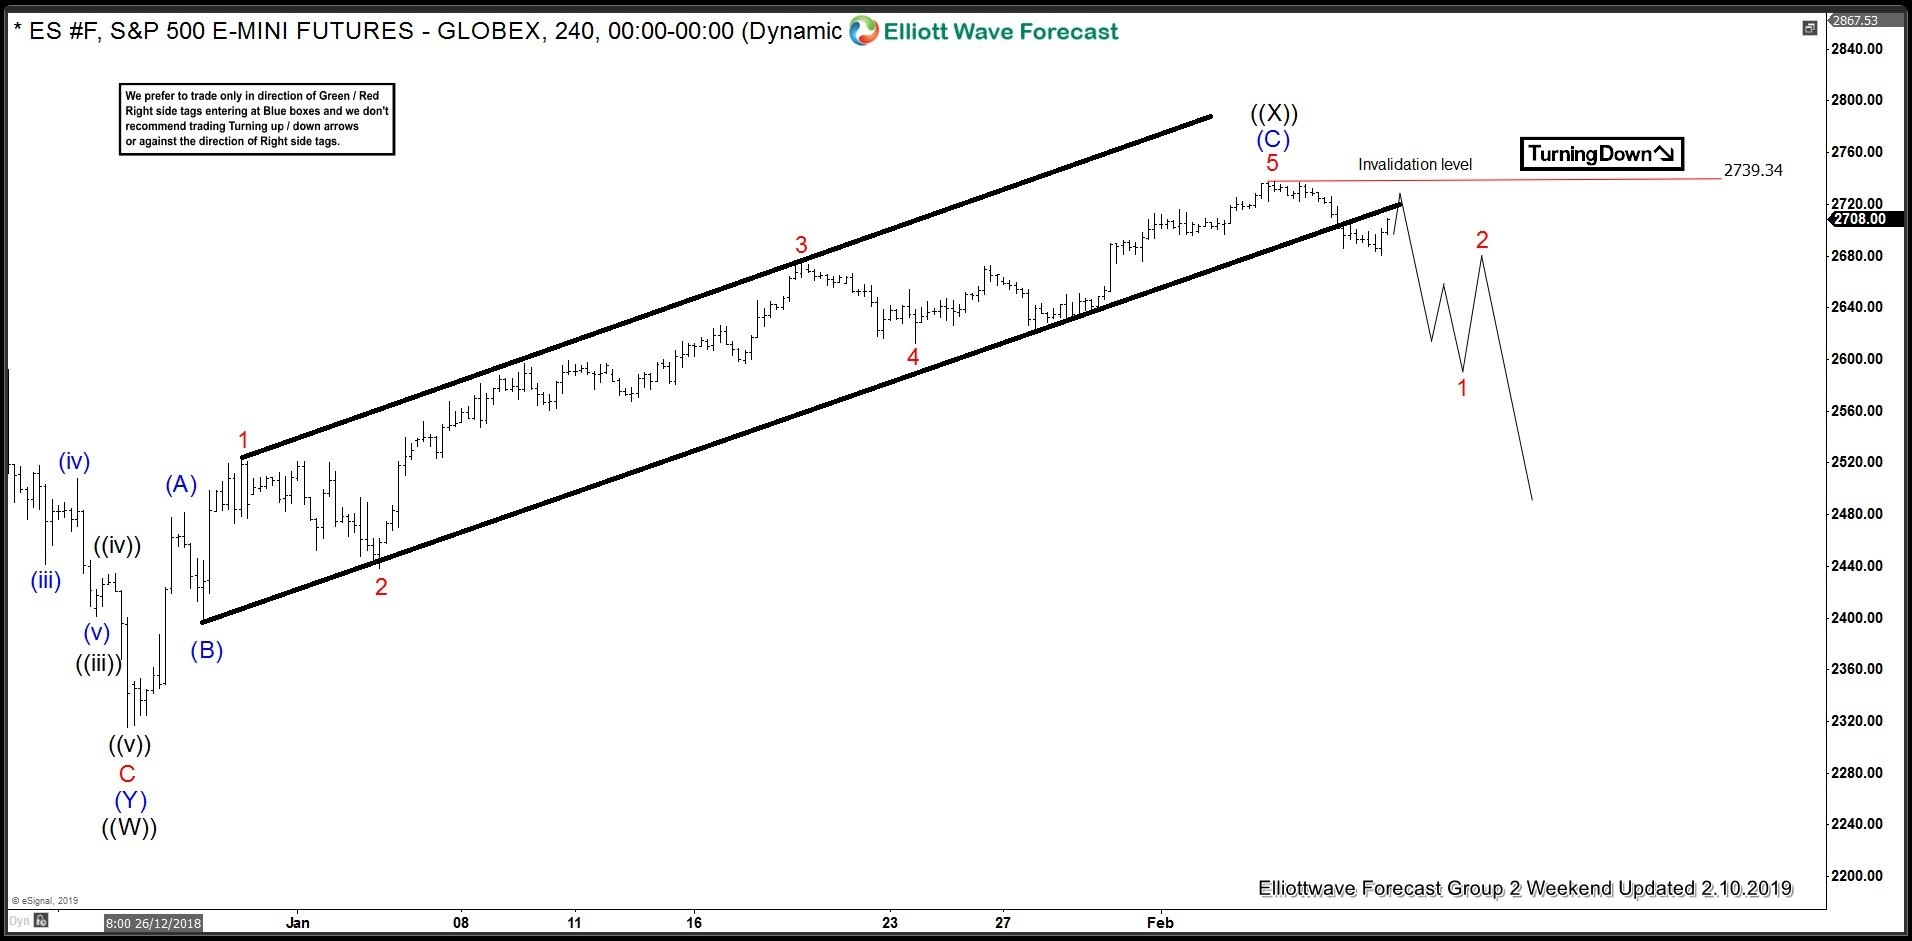
S&P 500 E-Mini Futures chart above shows the Index breaking below the parallel channel. This suggests a potential that the cycle from Dec 25, 2018 low has ended. In the shorter cycle, there is yet not enough separation from last week’s high at 2739.3 to be comfortable with this idea. However, the break below the channel is an early indication that we may have formed the secondary high in the ES_F. As such, while the rally fails below 2739.3, but more importantly below last year’s high at 2947, the Index can either resume lower or pullback in 3 waves at least. If the Index breaks above 2739.3 then it still remains in the process of forming the secondary high, i.e. wave ((X)). However, even if it breaks above 2739.3, the Index is likely not going to break above 2947 without at least a significant 3 waves pullback first.
Become a Successful Trader and Master Elliott Wave like a Pro. Start your Free 14 Day Trial at - Elliott Wave Forecast.
Author

Elliott Wave Forecast Team
ElliottWave-Forecast.com


