Hard Red Winter Wheat is one of the grain commodities, along with soft red wheat, corn, soybeans and others. Within the wheat family, first of all, there is a fundamental difference between two wheat types. Soft wheat is low in protein and is basically used in cakes in pastries. By contrast, hard wheat has a higher content of protein and it founds itself in breads and hard baked goods. Some time ago, trading of hard wheat took place at Kansas City Board of Trade. Then, it moved to Chicago. One can trade hard wheat futures at Chicago Board of Trade under the ticker $KE. Hereby, the contract size is 5’000 bushels (300’000 pounds) each and the prices are in Dollars US per 100 bushel.

In december 2020, the initial article has presented our bullish view. As a matter of fact, the prices climbed from 524 USD in decmeber 2020 towards 738 USD by August 2021. Now, we expect a short term pullback. Then, a rally towards 1000 USD and higher should take place.

Hard Red Winter Wheat Weekly Elliott Wave Analysis 09.19.2021

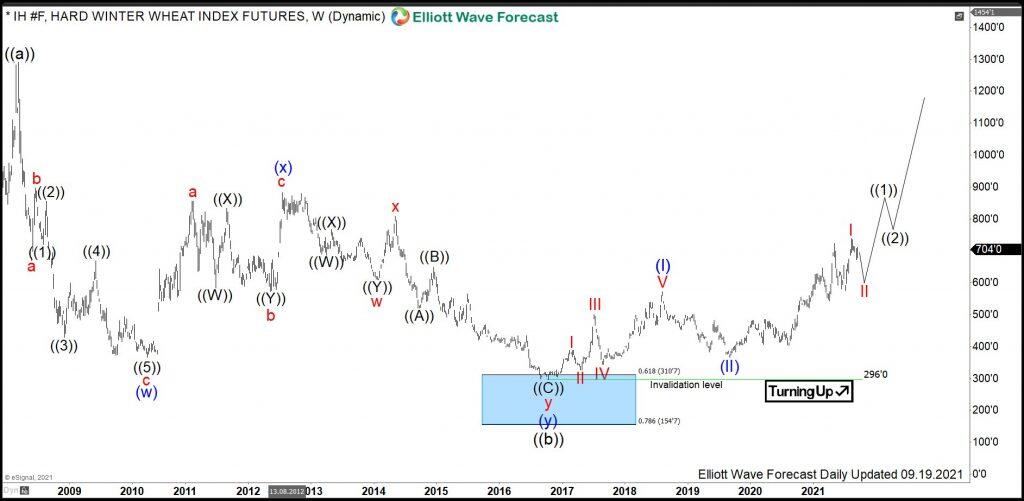
The weekly chart below shows the Hard Winter Wheat front contract IH #F. From the all-time lows, the prices have developed a cycle higher in black wave ((a)) of a grand super cycle degree. It has ended in March 2018 at 1148 Dollars. From the highs, a correction lower in wave ((b)) has unfolded as an Elliott Wave double three pattern. In 8 years, as a matter of fact, IH #F has lost 3/4 of the price reaching 296 Dollars per 100 bushel. It is the preferred view that an important bottom on October 2016 has been set and the black wave ((b)) has ended.

From the lows, consequently, a new rally within wave ((c)) may have started. Hereby, the super cycle degree waves (I) and (II) have already ended, while above 365, wave (III) is extending higher. It has reached the 625-785 target area. However, the RSI reading still shows a divergence as related to the wave (I). As a consequence, acceleration within wave (III) should still take place. Therefore, after ending wave I in August 2021, one should expect a consolidation in wave II and the following acceleration in wave III of (III). The medium-term target for coming 1-2 years will be towards 1000 USD per 100 bushel and even higher. Investors and traders can be looking to buy the pullback in wave II in 3, 7 or 11 swings against 365 lows expecting more upside.

2025-2030, the expectations are to break out to the new all-time highs. The long-term target for wave ((c)) to end will be 1444-2153 area.

FURTHER DISCLOSURES AND DISCLAIMER CONCERNING RISK, RESPONSIBILITY AND LIABILITY Trading in the Foreign Exchange market is a challenging opportunity where above average returns are available for educated and experienced investors who are willing to take above average risk. However, before deciding to participate in Foreign Exchange (FX) trading, you should carefully consider your investment objectives, level of xperience and risk appetite. Do not invest or trade capital you cannot afford to lose. EME PROCESSING AND CONSULTING, LLC, THEIR REPRESENTATIVES, AND ANYONE WORKING FOR OR WITHIN WWW.ELLIOTTWAVE- FORECAST.COM is not responsible for any loss from any form of distributed advice, signal, analysis, or content. Again, we fully DISCLOSE to the Subscriber base that the Service as a whole, the individual Parties, Representatives, or owners shall not be liable to any and all Subscribers for any losses or damages as a result of any action taken by the Subscriber from any trade idea or signal posted on the website(s) distributed through any form of social-media, email, the website, and/or any other electronic, written, verbal, or future form of communication . All analysis, trading signals, trading recommendations, all charts, communicated interpretations of the wave counts, and all content from any media form produced by www.Elliottwave-forecast.com and/or the Representatives are solely the opinions and best efforts of the respective author(s). In general Forex instruments are highly leveraged, and traders can lose some or all of their initial margin funds. All content provided by www.Elliottwave-forecast.com is expressed in good faith and is intended to help Subscribers succeed in the marketplace, but it is never guaranteed. There is no “holy grail” to trading or forecasting the market and we are wrong sometimes like everyone else. Please understand and accept the risk involved when making any trading and/or investment decision. UNDERSTAND that all the content we provide is protected through copyright of EME PROCESSING AND CONSULTING, LLC. It is illegal to disseminate in any form of communication any part or all of our proprietary information without specific authorization. UNDERSTAND that you also agree to not allow persons that are not PAID SUBSCRIBERS to view any of the content not released publicly. IF YOU ARE FOUND TO BE IN VIOLATION OF THESE RESTRICTIONS you or your firm (as the Subscriber) will be charged fully with no discount for one year subscription to our Premium Plus Plan at $1,799.88 for EACH person or firm who received any of our content illegally through the respected intermediary’s (Subscriber in violation of terms) channel(s) of communication.

Recommended Content


Recommended Content

Editors’ Picks

EUR/USD clings to daily gains above 1.0650

EUR/USD clings to daily gains above 1.0650

EUR/USD gained traction and turned positive on the day above 1.0650. The improvement seen in risk mood following the earlier flight to safety weighs on the US Dollar ahead of the weekend and helps the pair push higher.

EUR/USD News

GBP/USD recovers toward 1.2450 after UK Retail Sales data

GBP/USD recovers toward 1.2450 after UK Retail Sales data

GBP/USD reversed its direction and advanced to the 1.2450 area after touching a fresh multi-month low below 1.2400 in the Asian session. The positive shift seen in risk mood on easing fears over a deepening Iran-Israel conflict supports the pair.

GBP/USD News

Gold holds steady at around $2,380 following earlier spike

Gold holds steady at around $2,380 following earlier spike

Gold stabilized near $2,380 after spiking above $2,400 with the immediate reaction to reports of Israel striking Iran. Meanwhile, the pullback seen in the US Treasury bond yields helps XAU/USD hold its ground.

Gold News

Bitcoin Weekly Forecast: BTC post-halving rally could be partially priced in Premium

Bitcoin Weekly Forecast: BTC post-halving rally could be partially priced in

Bitcoin price shows no signs of directional bias while it holds above  $60,000. The fourth BTC halving is partially priced in, according to Deutsche Bank’s research. 

Read more

Week ahead – US GDP and BoJ decision on top of next week’s agenda

Week ahead – US GDP and BoJ decision on top of next week’s agenda

US GDP, core PCE and PMIs the next tests for the Dollar. Investors await BoJ for guidance about next rate hike. EU and UK PMIs, as well as Australian CPIs also on tap.

Read more

Majors

Cryptocurrencies

Signatures