Gold’s weekly update: Gold’s price faces key hurdles as multiple events are digested by the markets

Gold’s price has been on the decline for the past three trading days and is currently just below $4000 per troy ounce. In today’s report we are to discuss the rate cut doubts cast by the Fed last week, the ‘peace’ agreement between China and the US in regards to trade, the issues of an ongoing Government shutdown and lastly some data for Gold trends for Q3 provided from the WGC. For a rounder view we are to provide a technical analysis of gold’s daily chart.
Fed cast doubt over another rate cut by EOY
The Fed’s meeting occurred last Wednesday and thus we haven’t had a chance to address it in our weekly gold outlook. Although the initial market reaction has already occurred, the apparent hawkish stance by Fed policymakers and in particular Fed Chair Powell who stated that a December rate cut “is not a foregone conclusion”, could influence gold’s price for the remainder of the month as more Fed policymakers are anticipated to take to the “stage” to note their views. Hence, should the sentiment from other policymakers indicate a hesitancy to cut rates in their December meeting could aid the dollar whilst weighing on gold’s price given the two instruments' inverse relationship. On the other hand, should the narrative appear to shift in favour of a possible rate cut in their final meeting of the year it could possibly aid gold’s price. In our opinion, we wouldn’t be surprised to see Fed policymakers maintaining a relatively “hawkish” tone for the remainder of the month, yet considering the possible negative implications on the US economy as a result of the ongoing government shutdown, the narrative may change should data emerge that casts significant concern over the state of the US economy. In conclusion, the comments by the Fed Chair may have weighed on gold’s price, but the narrative could possibly change by December.
US-China “peace” agreement calms the markets
One of the main concerns leading up to the beginning of this month was the ongoing trade standoff between China and the US. That issue appears to have since been resolved with China agreeing to suspend the global implementation of the expansive new export controls on rare earths and related measures that were announced on October 9th, the suspension of retaliatory tariffs that were announced on the 4th of March as well as terminating its various investigations targeting U.S. companies in the semiconductor supply chain, including its antitrust, anti-monopoly, and anti- dumping investigations amongst other agreements, per the White House. From the US’s side, the United States “will lower the tariffs on Chinese imports imposed to curb fentanyl flows by removing 10 percentage points of the cumulative rate, effective November 10, 2025” amongst other pledges per the same statement from the White House. Overall, the apparent conclusion of the trade war between the two largest economies in the world may have resulted in safe haven outflows from the precious metal, which in turn may have weighed on gold’s price. In our view, we do not see the case for tensions flaring up between the two economic behemoths in the near future.
US Government shutdown continues
The US Government has been closed for the past 35 days bring it on par with the longest US Government shutdown which occurred during President Trump’s first presidency. The ongoing Government shutdown continues to negatively affect the US economy and thus the longer it continues, the greater the concern over the true state of the US economy. Therefore, should recession worries resurface for the US economy, gold may gain safe haven inflows from investors which could aid the precious metal’s price and vice versa. However,we should note that some optimism appears to have emerged which could result in the re-opening of the US Government and thus the positive developments may weigh on gold’s price.
US Gold trends for Q3
According to data from the World Gold Council or WGC for short, “Total gold demand, including OTC, grew 3% y/y to 1,313t, the highest quarterly total in our data series. Yet this was eclipsed by the value measure of demand, which jumped 44% y/y to a record of US$146bn in Q3” with the main driver of demand being investors. In turn, should investor demand continue it could possibly aid gold’s price.
Technical analysis
XAU/USD daily chart
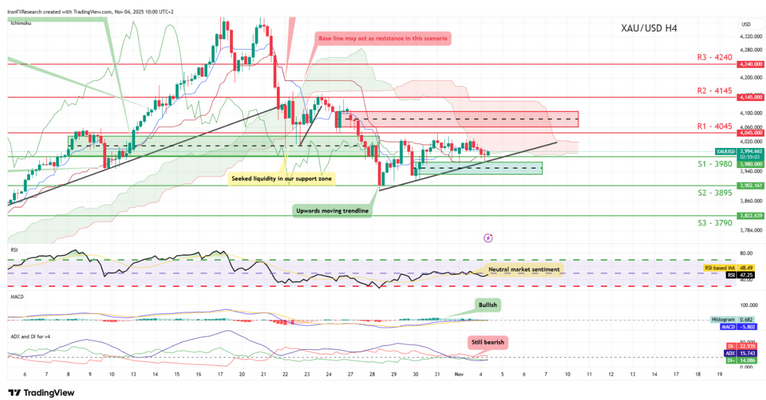
- Support: 3980 (S1), 3895 (S2), 3790 (S3).
- Resistance: 4045 (R1), 4145 (R2), 4240 (R3).
XAU/USD appears to be moving in a slight upwards fashion. Yet with the Ichimoku cloud possibly acting as a resistance area, we would instead opt for a cautiously sideways bias for the commodity. For our sideways bias to be maintained we would require gold’s price to remain confined between our 3980 (S1) support level and our 4045 (R1) resistance line. On the other hand, for a bearish outlook we would require a clear break below our 3980 (S1) support level and our upwards moving trendline which was incepted on the 28th of October, with the next possible target for the bears being our 3895 (S2) support line. Lastly, for a bullish outlook we would require a clear break above our 4045 (R1) resistance line with the next possible target for the bulls being our 4145 (R2) resistance level.
Author

Phaedros Pantelides
Independent Analyst
Mr Pantelides has graduated from the University of Reading with a degree in BSc Business Economics, where he discovered his passion for trading and analyzing global geopolitics.


