Gold trapped in no man's land

The precious commodity has had a very rough several weeks, tumbling nearly 200 dollars per troy ounce in the wake of the recent vaccine optimism. The reinvigorated investors and traders' enthusiasm catalysed the major selloff, as the global demand for safe-havens and other low-risk securities plummeted. The market is currently riding high on the expectations for a sharp rebound in global economic activity in 2021, but it is yet to come to terms with the realisation that it will take time before there can be worldwide vaccination.
The market could very well be getting ahead of itself, but eventually, traders and investors need to come to grips with the fact that no vaccine can be a substitute for lost productivity. Despite some notable improvements, the underlying economic situation is not yet as optimistic as it might seem at first glance.
Global manufacturing output is sinking across the board with China being a notable exception. Meanwhile, consumer confidence is recoiling in the Eurozone as well as in the US. French and German industries were hit unevenly in October, whereas Canada's economic growth was stymied in November.
All of these developments are evocative of mixed and uneven global recovery, which leaves a lot of the uncertainty that drove the last gold rally still mostly in effect. This means that gold's appeal should not be automatically written off due to the considerable hopes that are vested in an upcoming vaccine or vaccines.
Moreover, the end of December is typically characterised with low levels of liquidity as general trading activity falters around the holidays. Such a murky environment provides the ideal conditions for gold to shine, as traders seek refuge to hedge against heightened risks stemming from these low levels of liquidity.
The overall situation of gold continues to be looking ostensibly bearish, but there are definite conditions that could very likely reinvigorate the interest for the king of the safe-havens. That is why today's analysis examines the make-it-or-break-it scenario that the precious commodity is currently finding itself in.
1. Long-Term Outlook
As can be seen on the daily chart below, gold had been consolidating in a range roughly between the 23.6 per cent Fibonacci at 1927.24 and the 38.2 per cent Fibonacci at 1836.28 since mid-August. This was the case until recently when a notable breakdown was established on the 24th of November. Depending on whether this pans out to be a decisive breakdown or a fakedown, the price action could either establish a new downtrend or rebound back towards the 23.6 per cent Fibonacci.
As regards the arguments in favour of a rebound, there are several of them that warrant closer examination. The price action has recently developed a 'Morning Star' pattern, which is typically found at the lower end of a recent downtrend and is taken to entail a likely bullish reversal. The dip of the star coincides with the lower end of a downwards-sloping regression channel, which in itself is expected to prompt such a rebound.
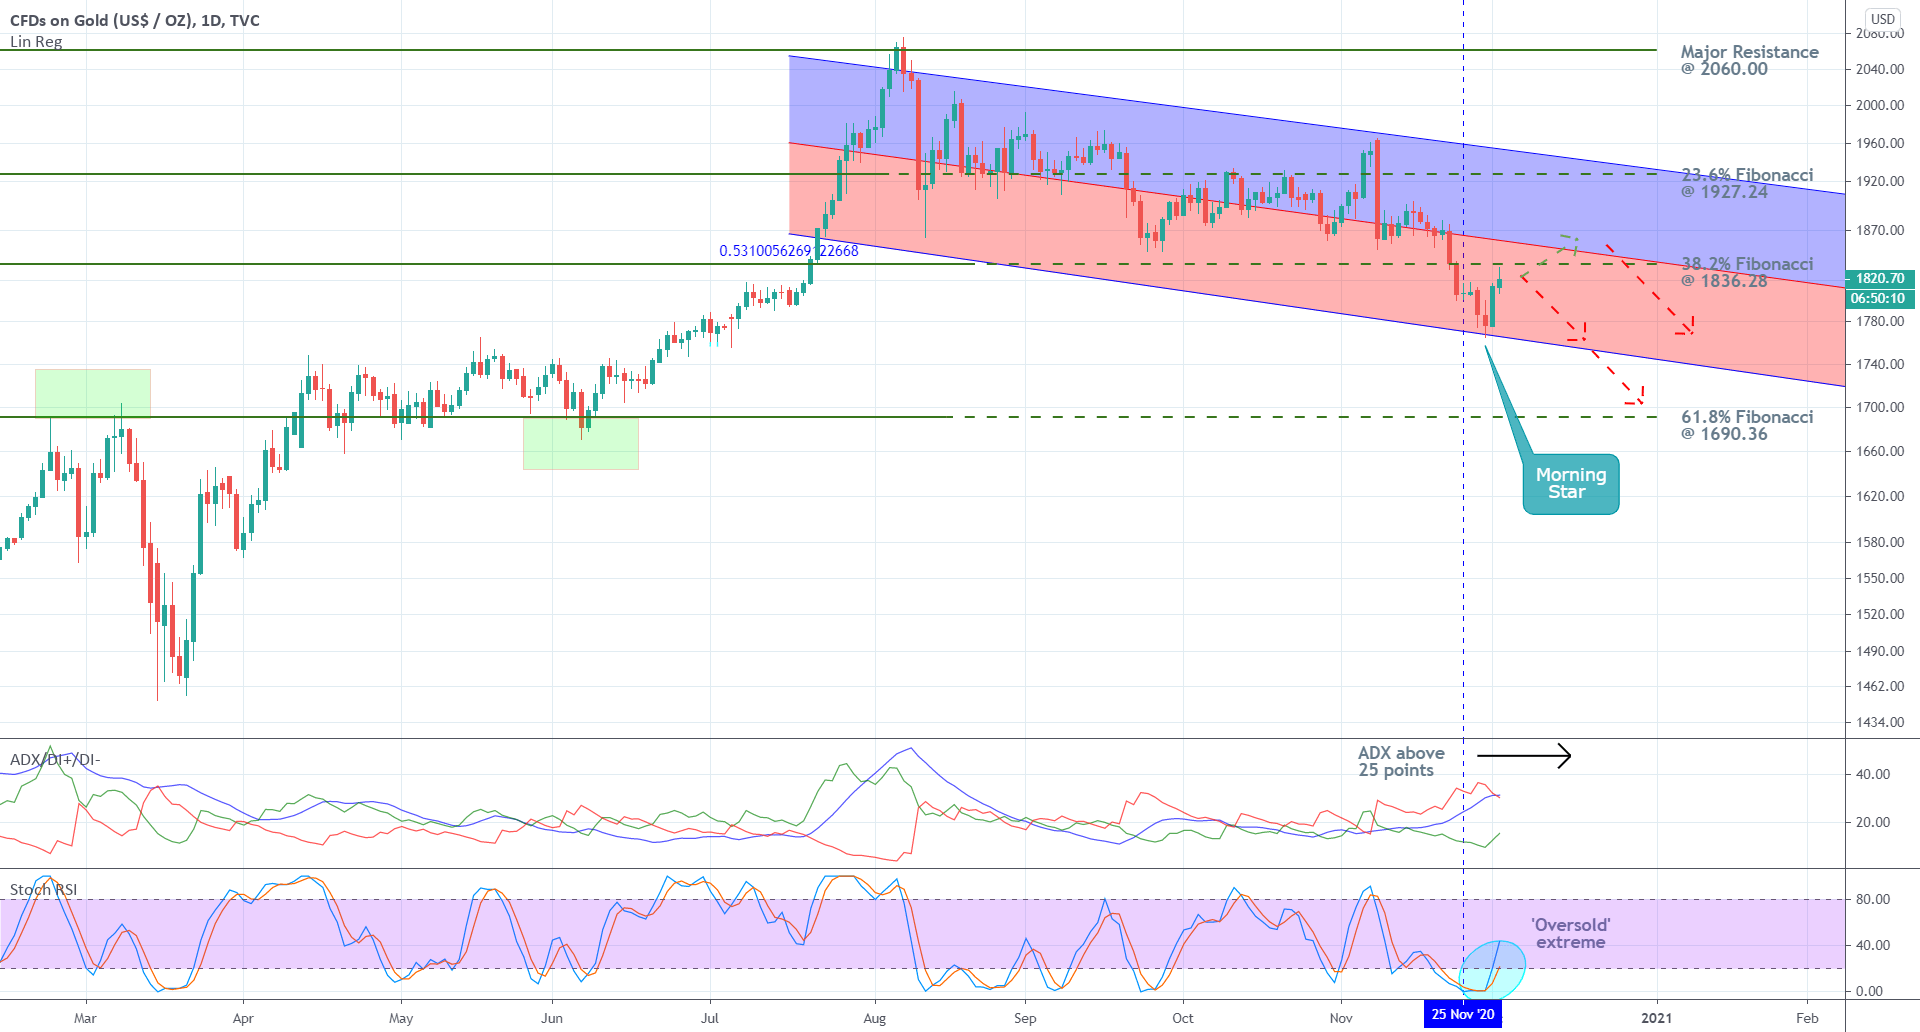
Furthermore, the ADX indicator crossed above the 25-point benchmark on the 25th of November, which technically means that the market is currently trending. Nevertheless, it should be emphasised that the transition from the previous range-trading environment is still fairly new, which means that the continuation of the newly emerging trend is far from being certain. Quite the contrary, the 'Oversold' Stochastic RSI indicator also favours a rebound in demand for gold.
On the other hand, the recent uptick of the price could very likely turn out to be a minor bullish pullback, as a part of the broader downtrend that is currently emerging. The breakdown below the 38.2 per cent Fibonacci was a major stepping stone, so it is only natural to expect subsequent bullish ripples. Even still, this Fibonacci retracement has now adopted the new role of a prominent resistance. That is why the price could continue tumbling, given that it currently coincides with the middle line of the regression channel.
If the former scenario turns out to be correct, provided that the price action manages to break back above the 38.2 per cent Fibonacci and the middle line of the channel, it could once again attempt to upsurge towards the 23.6 per cent Fibonacci. Conversely, if the latter scenario unfolds next, then following the termination of the bullish correction, probably around the 38.2 per cent Fibonacci, the subsequent development of the downtrend could be continued towards the next psychological barrier – the 61.8 per cent Fibonacci at 1690.36.
2. Short-Term Outlook
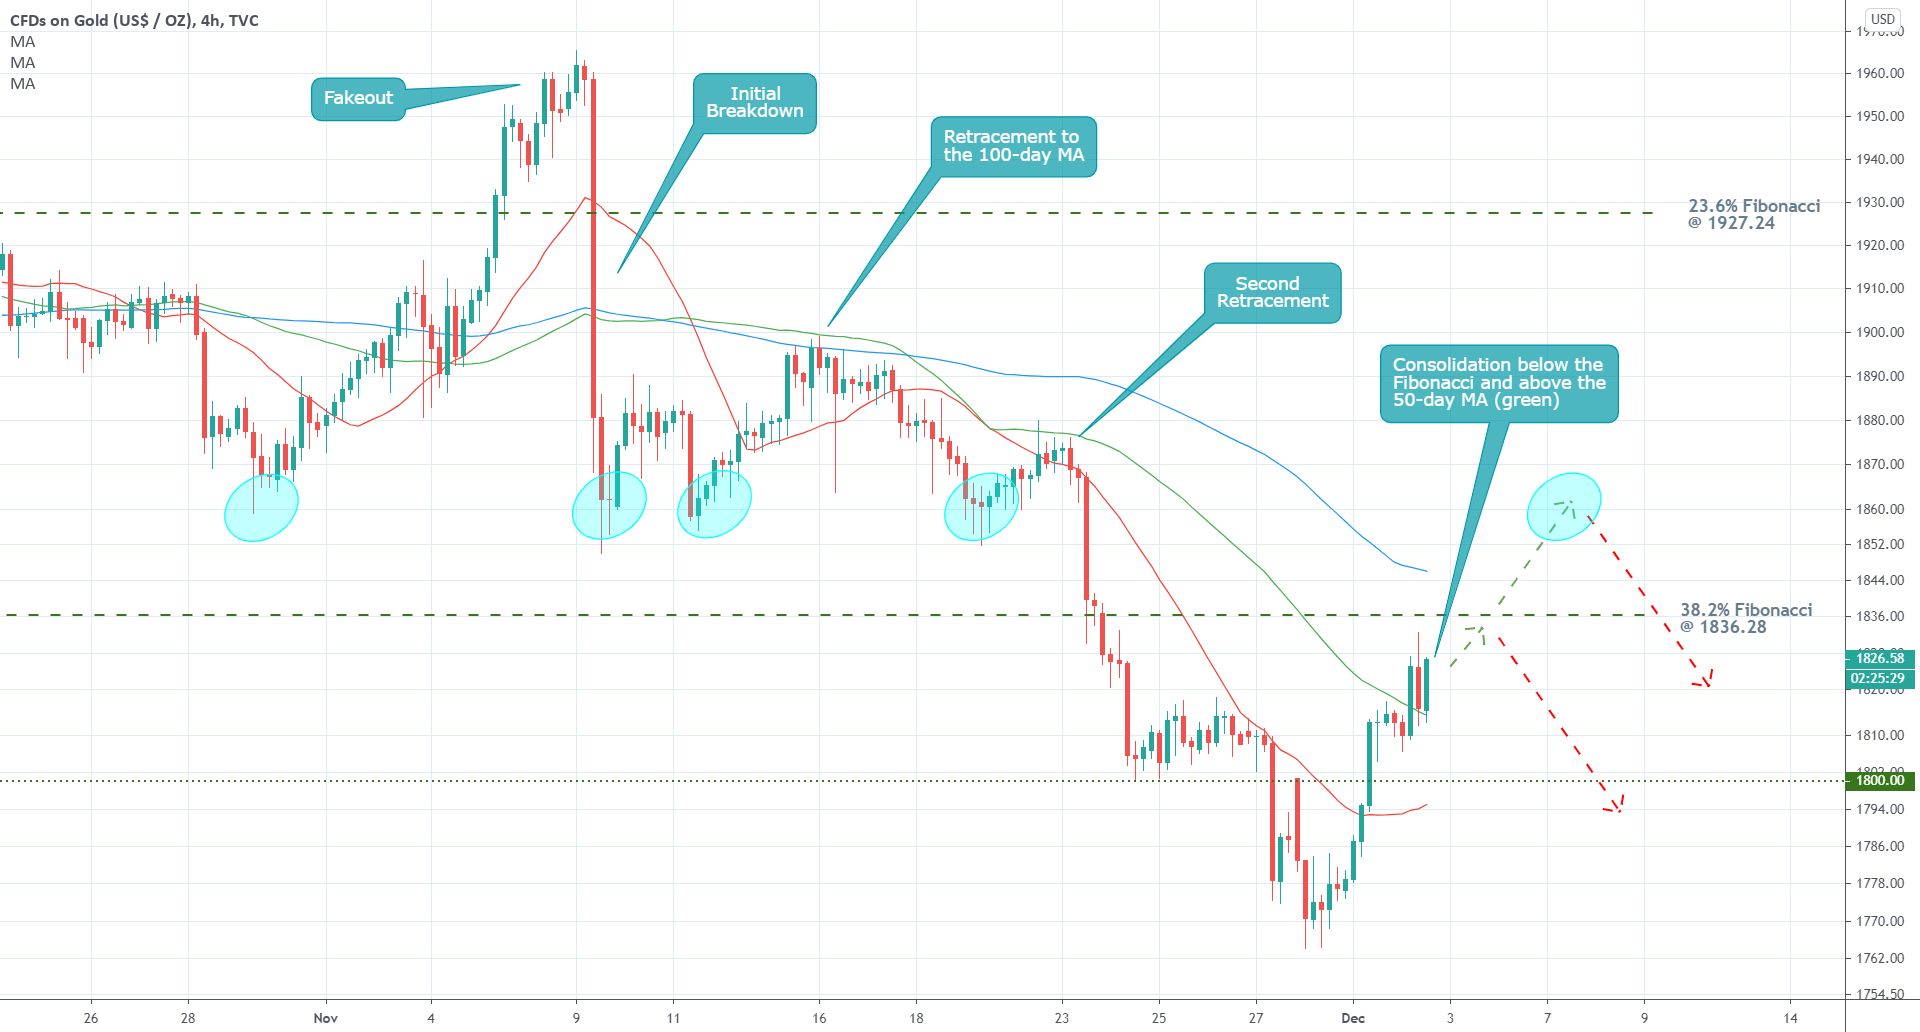
The 4H chart above follows the behaviour of the last downswing and examines its most prominent stages closely. As can be seen, the four subsequent tests (blue ellipses) of the area around 1860.00 have underpinned the existence of a strong support (now resistance) level there. So, the market would have a difficult time in breaking out above 1860.00, and that is why both bears and bulls need to observe the behaviour of the price action around the 1860.00 mark.
While the three moving averages follow the current 'Perfect Descending Order' – the 20-day MA (in red) trading below the 50-day MA (in green), which is trading below the 100-day MA (in blue) – the continuation of the underlying bearish sentiment would be confirmed. Nevertheless, there are definite signs of a potential trend reversal.
The snap rebound above the psychologically significant 1800.00 level followed by a consolidation of the price action above the 50-day MA, are both indications of the strengthening of the short-term bullish pressure.
Market bears would be looking to implement trend-continuation trading strategies, if the price action rebounds from the 38.2 per cent Fibonacci and the 100-day MA. Conversely, the bulls would be looking for bullish confirmation if the price action manages to break out above 1860.00.
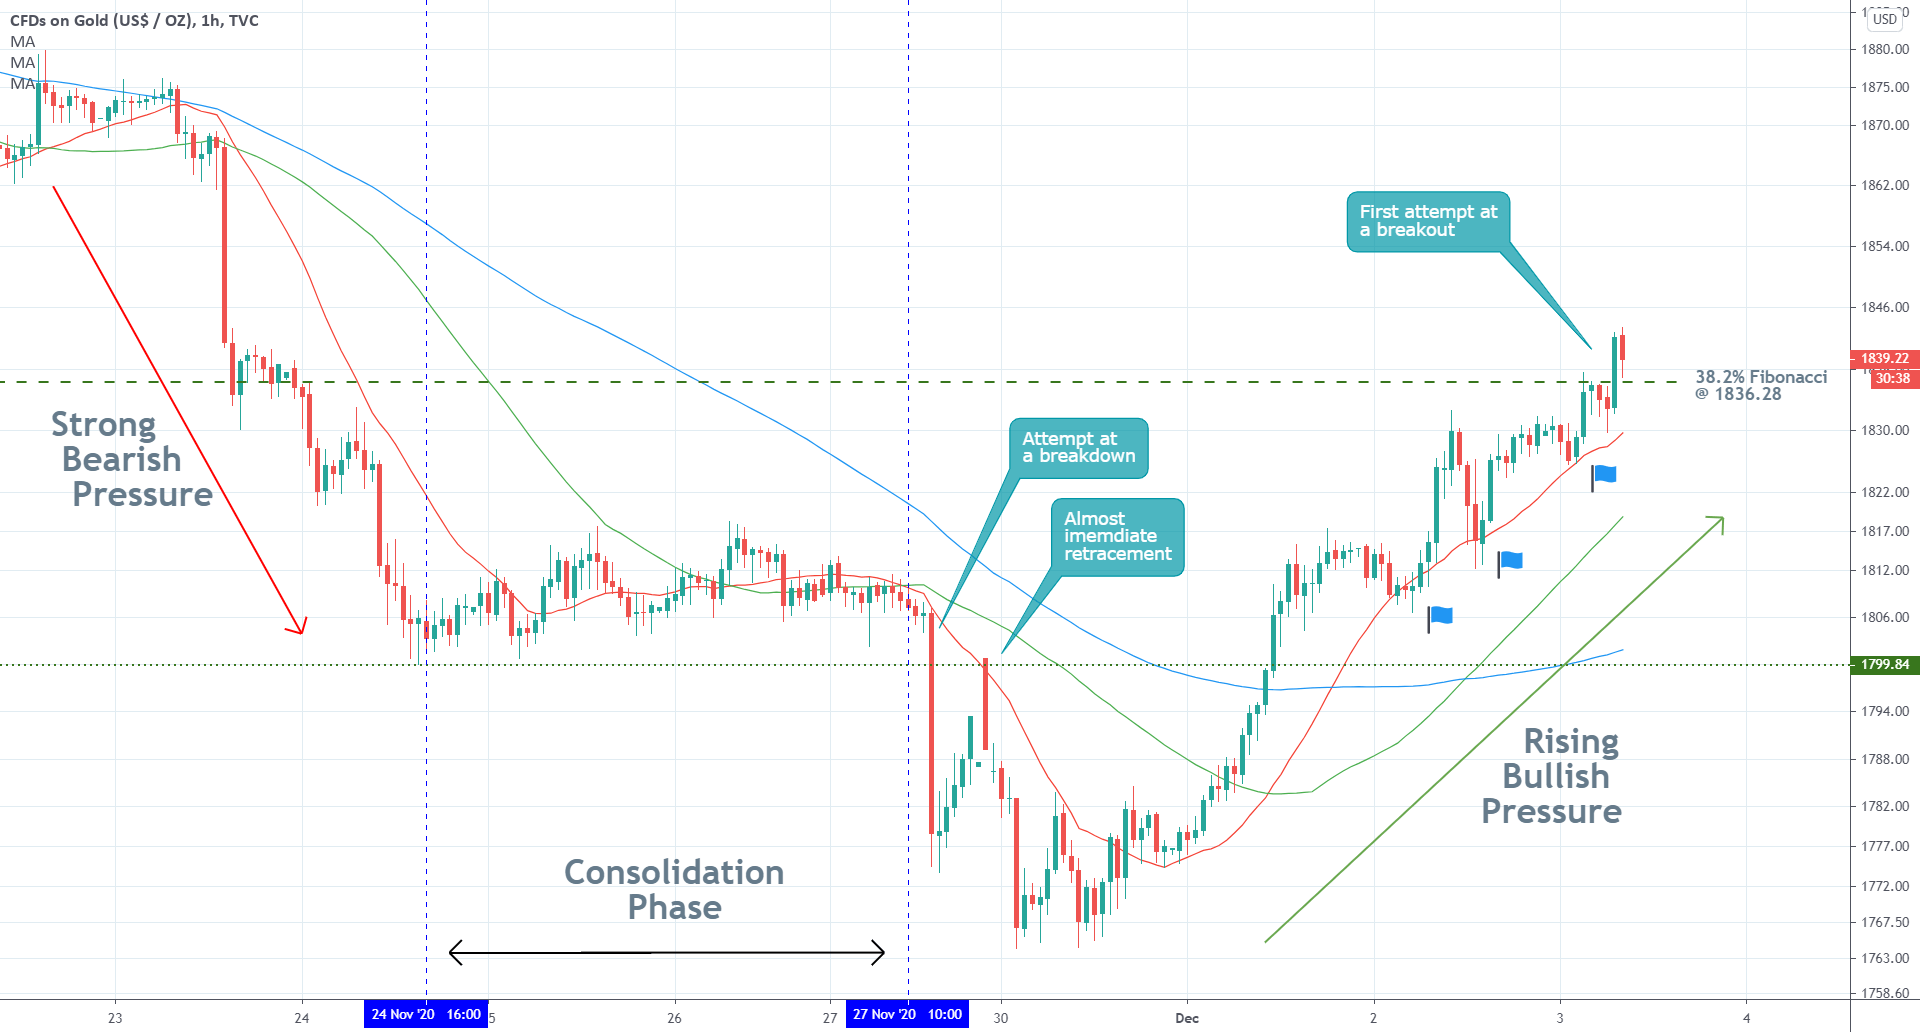
As can be seen on the hourly chart below, the price action is indeed trying to establish a complete trend reversal – from the previously strong bearish pressure, undergoing through the consolidation stage, to the presently rising bullish pressure. While this does not necessarily imply that the price action is bound to continue appreciating in the immediate future, certain developments can be monitored closely.
The price action is currently having its first go at breaking out above the 38.2 per cent Fibonacci, and everything would depend on whether or not this turns out to be a fakeout. If the price reverts itself back below this level, it will entail the probable continuation of the broader bearish trend. Moreover, even if the price climbs to the aforementioned 1860.00 resistance before reverting itself, the bears would still have the possibility to use trend-continuation strategies.
Conversely, the concentration of the price action in a temporary range between 1860.00 and 1836.28 would allow the bulls to seek favourable entry. They should not do so immediately, however, as joining at the mid-point of an existing upswing would make them vulnerable to erratic fluctuations. Rather, they can sit and wait to see just how low the next bearish correction goes. They need to be certain that the following bearish correction is not actually a continuation of the broader downtrend.
3. Concluding Remarks
At present, both bears and bulls (who do not have open positions) would be better off to sit and wait to see how the market behaves next. Once the current bullish pressure (in the short-term) is exhausted, the market is likely to establish a bearish correction afterwards. Depending on how low the price sinks to next – below or above the 38.2 per cent Fibonacci - would demonstrate whether or not the market would continue climbing afterwards.
Author

Plamen Stoyanov
Trendsharks
Plamen started his career on the global capital markets in 2012 when he began trading with financial derivatives.


