Gold still soaring at multi-year highs on geopolitical tensions

Market Overview
Since the Fed meeting last week, the dollar has been panned. The prospect of looser monetary policy from the Fed has been a big drag on shorter dated yields, as differentials have turned sour for the greenback. Although the yen and Swissy are performing well on a relative basis, it is notable that the euro is also in a sweet spot for now. However, the drive higher on EUR/USD is nothing compared to that on gold. There are several factors which are combining to pull gold to multi year highs, including the Fed and geopolitical fears. Another breakout above the $1433 May 2013 high was seen early this morning. Not only is there the prospect of a dovish Fed, but also trade tensions and also geopolitical tensions in the Persian Gulf as the US imposes sanctions on Iran following the downed drone last week. There is starting to be a degree of consolidation on forex this morning, but gold remains strong. Will the G20 meeting between Presidents Trump and Xi be the catalyst for a big market shift once more? The uncertainty over this meeting and its implications for Fed policy are likely to mean investors increasingly cautious through the coming days.

Wall Street closed lower with the S&P 500 -0.2% at 2945, whilst US futures are around -0.3% lower in early moves today. This has pulled on Asian markets lower, with the Nikkei -0.4% and Shanghai Composite -1.3%. In Europe, the outlook is similarly cautious to the US, with FTSE futures and DAX futures both around -0.4% lower. In forex, there is a shade of USD underperformance still, with JPY being the main outperformer, along with NZD. In commodities, the run higher on gold shows little sign of stopping, whilst there is a consolidation on oil with a slight slip back of -0.5%.
The economic calendar is fairly bare through the European morning, with US data then dominating later in the session. The Case Shiller House Price Index at 1400BST is expected to drop another tenth of a percent to +2.6% (from +2.7% in May) which would be a twelfth consecutive month of declining growth. The Conference Board’s Consumer Confidence for June is at 1500BST is expected to slip back slightly to 132.0 (from 134.1 in May) which would still suggest the US consumer remains positive. US New Home Sales are at 1500BST and are expected to improve by 1.0% to 686,000 in May (from 673,000 in April). After Fed Chair Powell’s comments in the FOMC meeting last week, the regional Fed surveys are worth watching now. The Richmond Fed Manufacturing is at 1500BST and is expected to improve to 7 (from 5 last month).
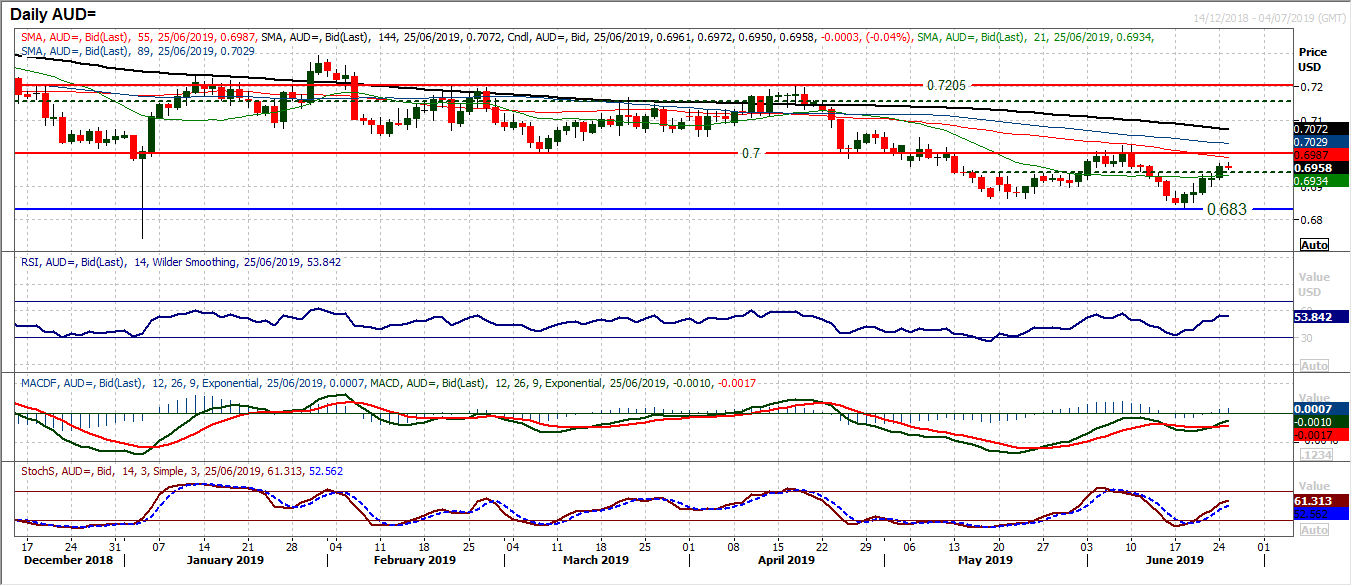
There has been an appreciable rebound on the pair sine the Fed decision. However, this looks as though it is setting the market up for another chance to sell. A run of now five consecutive positive closes shows that the near term recovery is in full swing. However, this is still playing counter to the more considerable negative outlook of the medium term outlook. Since the market broke decisively below $0.7000 as a basis of support, the bears have been in control. There is a consistent negative configuration on momentum indicators, with the RSI has consistently failed around 60 throughout 2019 (currently at 54), whilst MACD lines are below neutral. Rallies should still be treated as a chance to sell. Having broken above a near term pivot around $0.6940 there is upside potential in the recovery towards $0.7000. However, this opens the market to the overhead supply around $0.7000 which held the earlier June rally and sold off. Await failure signals on the hourly chart, such as MACD below neutral and hourly RSI below 35. The initial support is $0.6940. A failure back under $0.6900 re-opens the $0.6830/$06960 lows. A decisive move above $0.7000, resistance is key $0.7050/$0.7070.
EUR/USD
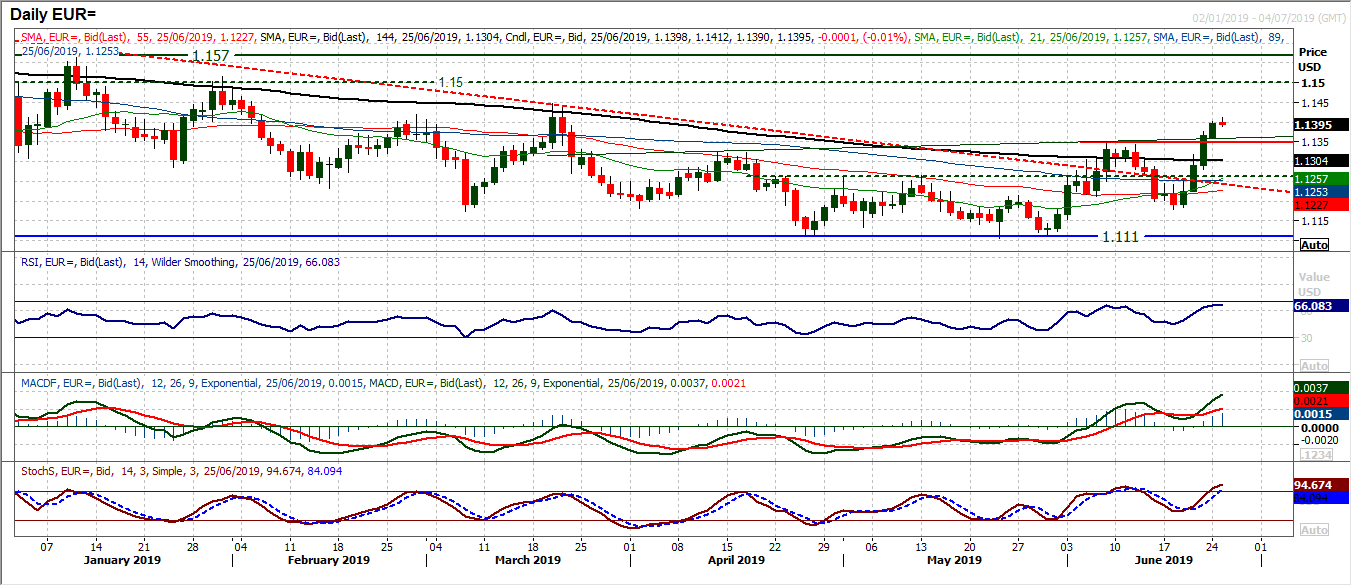
The rally on the euro has been incredible in the days since the FOMC decision. There have been four very positive bull candles, with consistent buying into intraday weakness. Technically, the breakout above $1.1347 was a key move. Not only has this taken the market to a three month high, but also now formed a new development of higher lows and higher highs. Given the positive configuration on MACD and RSI, this is an extremely important development for the outlook as this is also arguably a three month base pattern too. The two day breakout above $1.1347 (yesterday’s entire session above too), means that this is a key area of support now. At the least, the outlook is now neutral, but how the market responds to the neckline support around $1.1325/$1.1350 will be telling of the control the bulls now have. A slight slip back on hourly chart this morning is an early test. The next resistance is the March high at $1.1450.
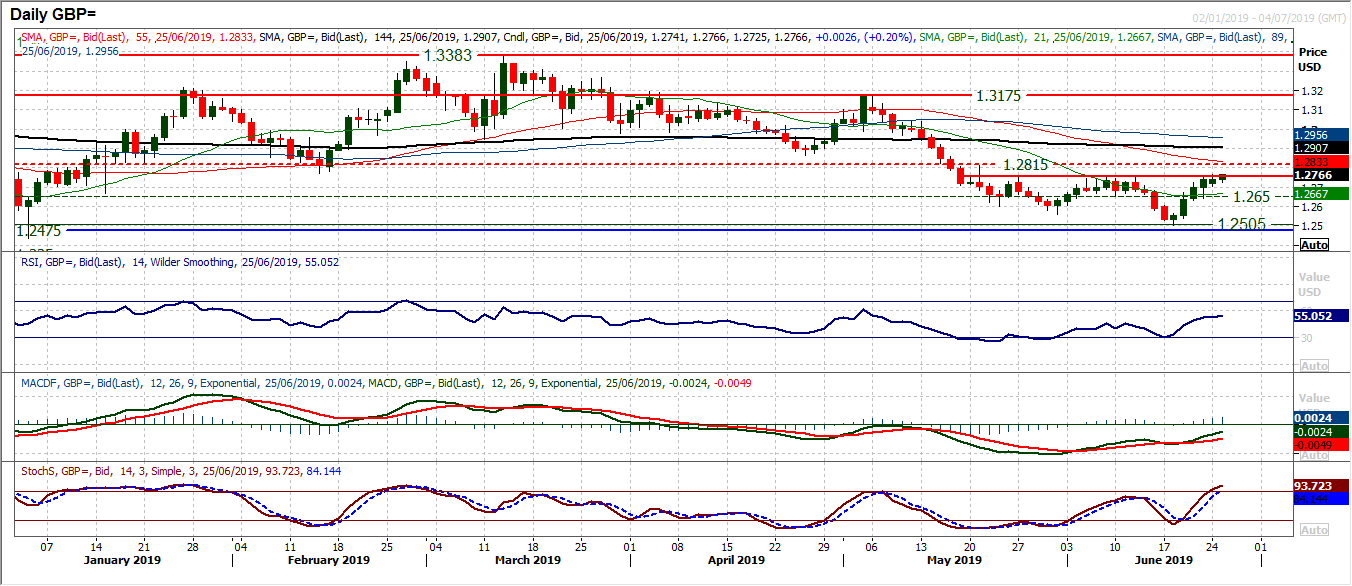
A big base pattern formation has completed on EUR/USD, which will encourage Cable bulls in their recovery. However, for now, the resistance around $1.2760 is still restrictive. There is a tentative nature to this rally. Momentum indicators are edging higher but with a lack of impetus (and also threatening to roll over). This is likely due to the heavy overhead supply between $1.2760/$1.2860. However, momentum indicators are nowhere near as positively configured as with EUR/USD. The RSI is stuck in the low 50s, whilst MACD lines are limping back towards neutral. If there is a turn of fortune for the dollar, it looks like Cable will be a key mover lower. In the meantime, the bulls struggle for traction. The past two sessions have attempted (and failed) around $1.2760, a level which is again resistance today. If hourly momentum indicators start to turn negative then this will look to be a step too far. Initial support at $1.2705 (yesterday’s low), with $1.2640 a key gauge now.
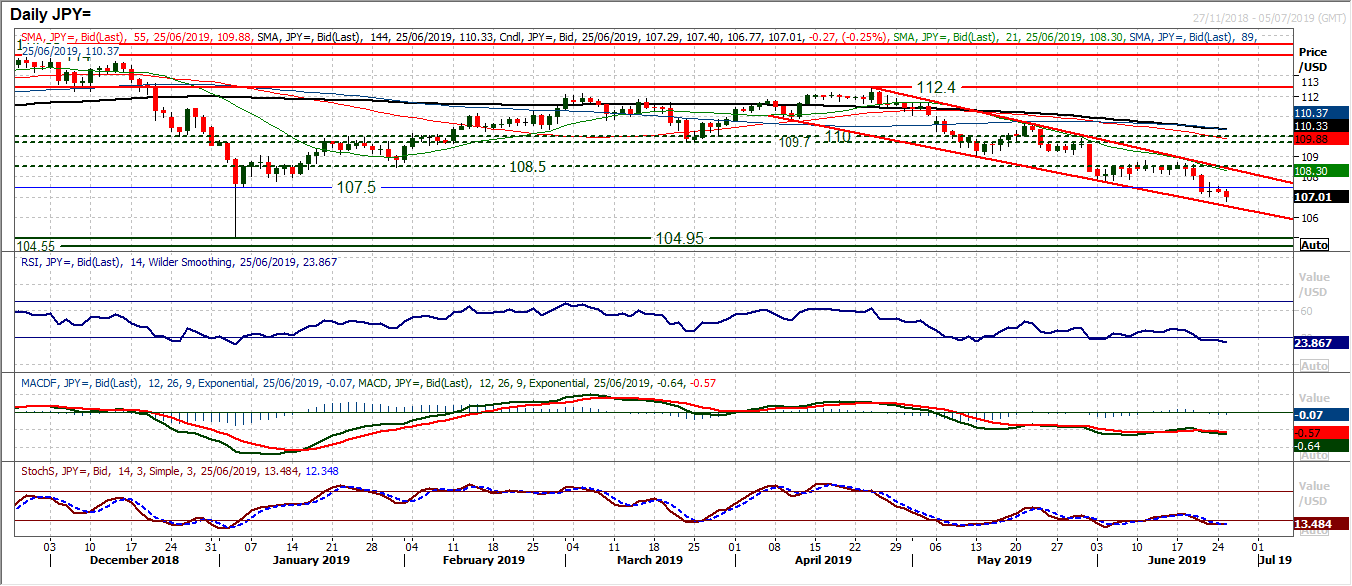
There is very little sign of the dollar bulls finding any sustainable foothold in the market right now. A consolidation on Friday (doji candle) failed to trigger any trend reversal in yesterday’s session. The early move lower in today’s session shows the outlook remains negative. The old minor support at 107.50 is also now a basis of resistance too as the market continues to fall. Selling into intraday strength continues. Momentum indicators are negatively configured, with the RSI falling further into the low 20s, whilst MACD and Stochastics show no sign of reversal. The hourly chart shows 50/60 on RSI is a selling opportunity, with MACD consistently negative. Early support today at 106.75 but there is little real support until the 104.50/105.00 area of the 2018 and 2019 lows.
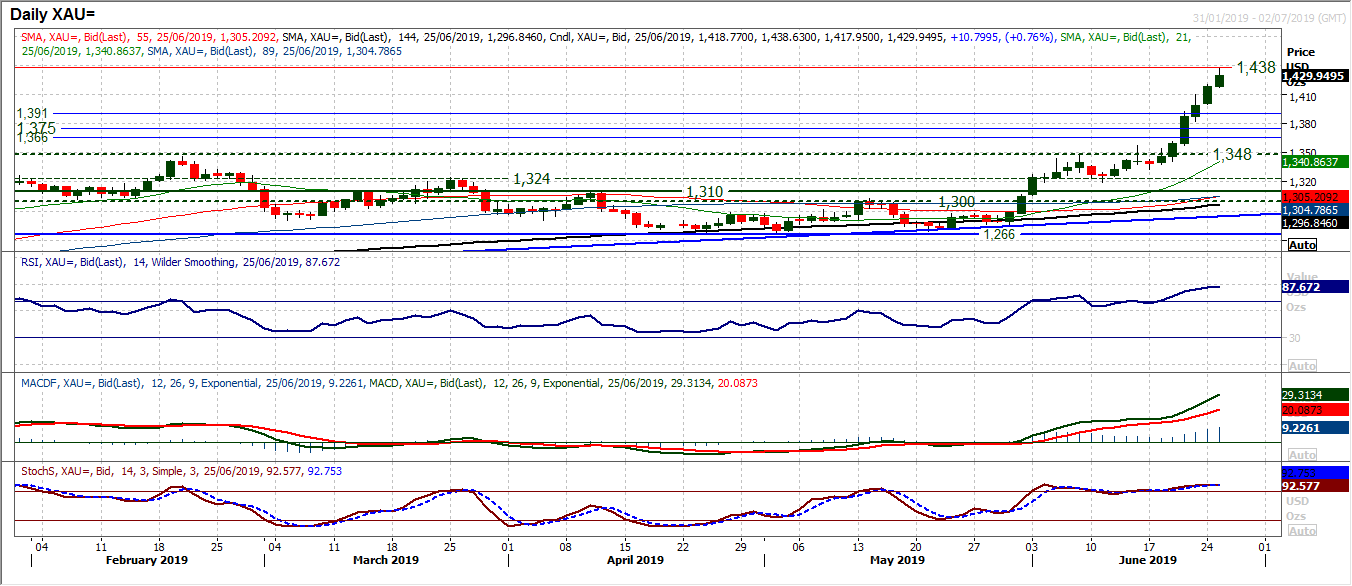
Gold
The run higher on gold remains impressively strong as another decisive positive candle formed in yesterday’s session. Such a strong candle to follow an uncertain close on Friday will have been very encouraging for the bulls. It also reflects an ongoing strength of sentiment and control the bulls have of the current trend. Despite the stretched position on the RSI, this remains a trend to be followed. For now, historic resistances just do not seen to be an issue. The RSI at 86 is at near three and a half year highs, yet the bulls have been happy to buy into intraday weakness (such as Friday) and consolidation (as with Monday). With this in mind, this this a bull trend to run with until there are far more explicit reversal signals that would really confirm decisive profit-taking. With another breakout this morning, nothing as such yet on the daily chart would suggest any reversal, but watch the hourly chart which may give an early indication. Watch for hourly RSI below 40 and hourly MACD below neutral. There is initial support at the breakout around $1410, with a pivot at $1400. A breach of $1400 support would certainly be something to take note of. Breaking $1433 means the next resistance is not until $1487 (May 2013 high).
WTI Oil
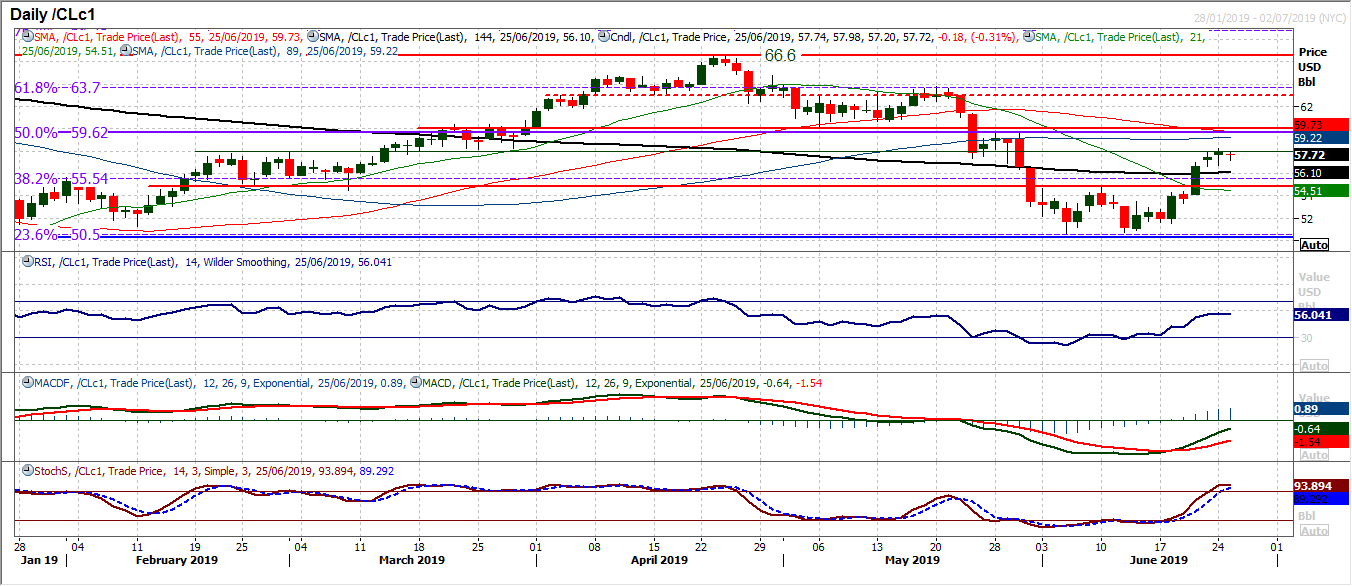
Having decisively broken above $54.85 to complete a three week base pattern (implying $59.10) WTI continues to recovery. Although the momentum of the move higher has waned slightly, there is still upside potential for now only the $59.10 target but also a move back towards the $59.60 consolidation area of the 50% Fibonacci retracement. Given the RSI is rising in the mid-50s, MACD lines advancing from a bull cross and Stochastics pushing above 80, there is still a suggestion of using near term weakness as a chance to buy. However, the next barrier to overcome is the old pivot at $58.00 which formed after a breakout above $58.00 from consolidation in March. This has been a barrier over the past couple of sessions and continues to be so this morning. However, we still favour the continued recovery and a close clear of $58.00 would open the upside once more. The hourly chart shows support initially at $56.65 above the neckline support at $54.85.
Dow Jones Industrial Average
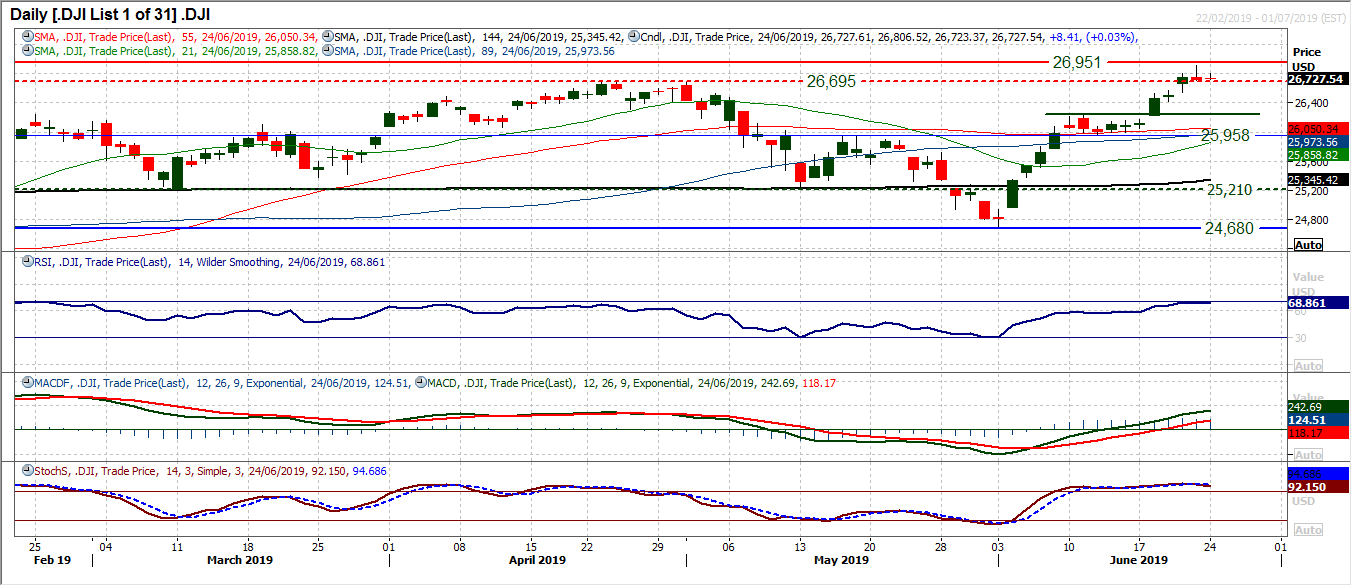
Trading against the Fed has proven to be a losing strategy in the past. Since the signals of potential rate cuts really came to the fore in early June, the Dow has rallied strongly. So what to do with a couple of candlesticks that hint at potential reversals lower. A couple of weeks ago a similar situation was forming, but the negative candles on the Dow turned into a consolidation phase, before another breakout. Friday’s small shooting star candle and yesterday’s (tiny) doji need to be watched. For now there is no burgeoning negative signals on momentum, which is very strong. For now this looks to be a consolidation around the 26,695 breakout, with the all-time high at 26,951 still the primary target. This may change under 26,540 initial support and if hourly RSI drops below 40 as hourly MACD moves decisively below neutral. For now though we remain bullish.
Author

Richard Perry
Independent Analyst


