Elliott wave Analysis: Gold renews the Path to $1450

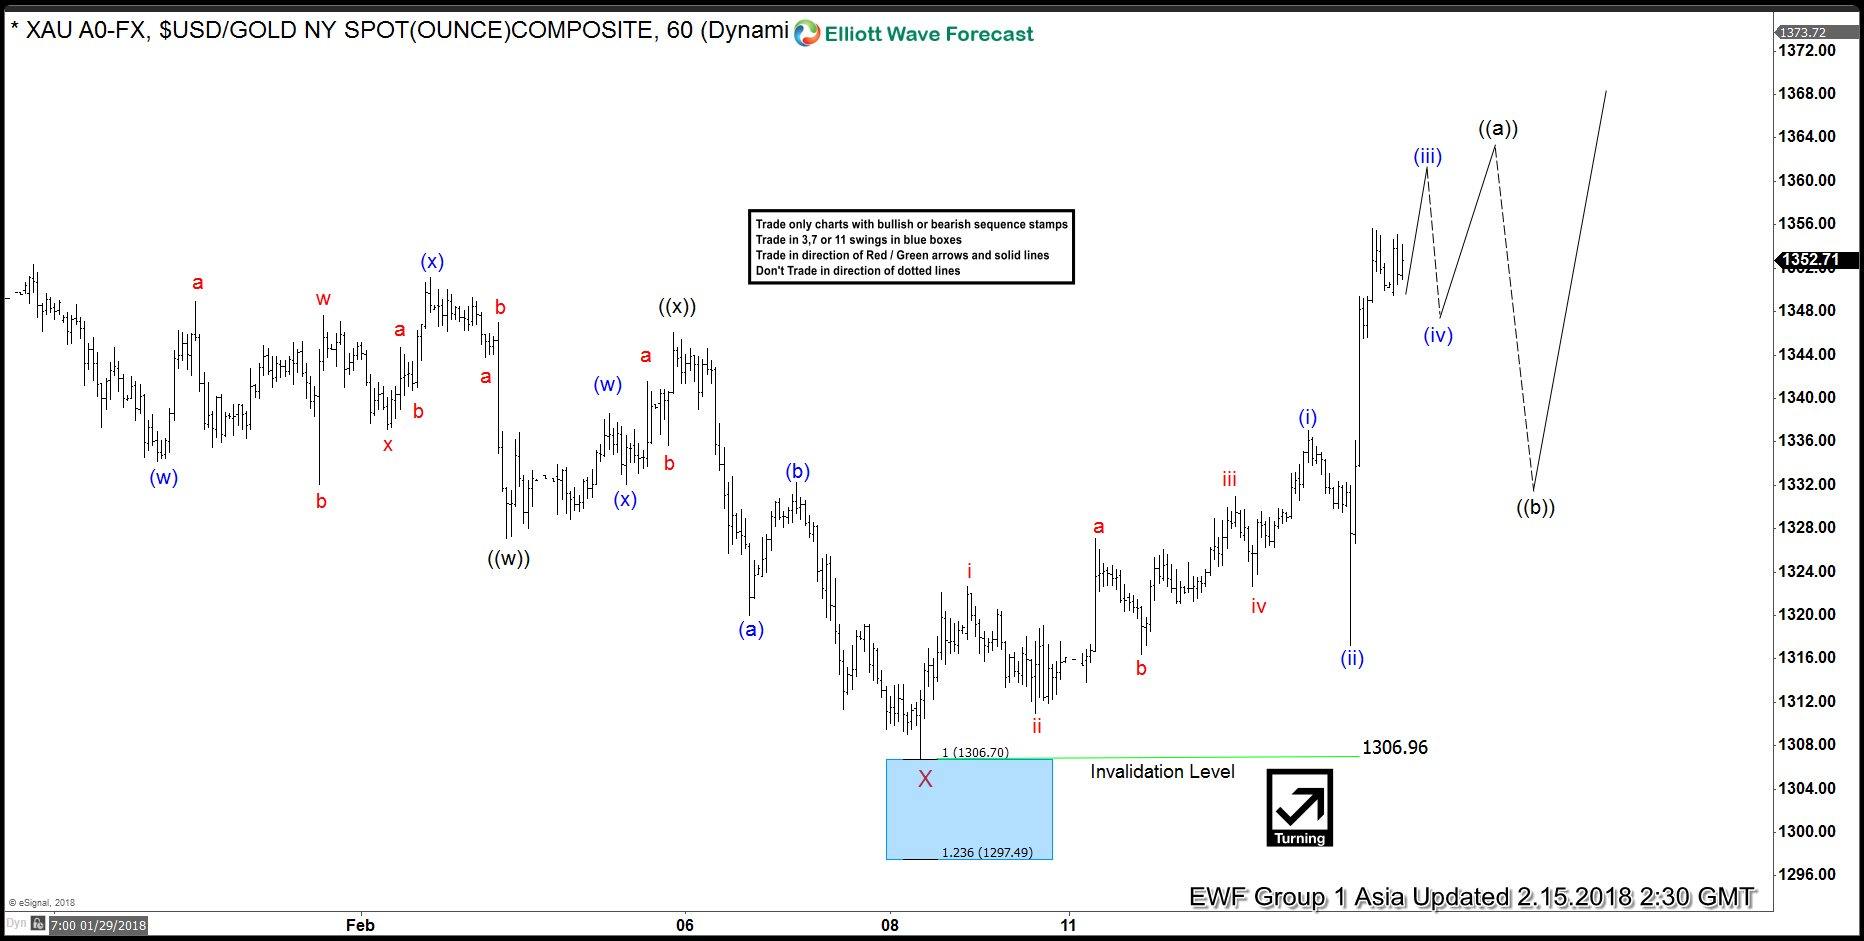
Gold Short-term Elliott Wave view suggests that the decline from January 25.2017 high (1365.96) to February 08.2018 low ended Minor wave X at 1306.96 low. After reaching the 100%-123.6% Fibonacci extension area of ((w))-((x)) at 1306.70-1297.49 area. When internals in Minor wave X unfolded as Elliott Wave Double Three Structure, where each leg had an internal distribution of 3-3-3 lower. Down from 1365.96 peak, Minute wave ((w)) ended 1327.24 low, Minute wave ((x)) ended at 1345.96 and Minute wave ((y)) of X ended on 1306.96 low.
Above from Minor wave X 1306.96 low, metal is expected to resume higher the rally in Minor wave Y higher targeting more upside in the metal towards 1450+ area to the upside. However, a break above 1365.96 high remains to be seen for final confirmation of next extension higher and until than double correction lower in Minor wave X dip can’t be ruled out yet. Near-term cycle from 1306.96 is expected to be unfolding as Elliott Wave Zigzag pattern and expected to see more upside towards 1365.67 area approximately to end the Minute wave ((a)) higher in 5 waves. Afterwards, metal should do a pullback in Minute wave ((b)) for the correction against 1306.96 cycle in 3, 7 or 11 swings before further upside extension is seen in the metal. We don’t like selling it and as far as a pivot from 1306.96 low remains intact during the dips yellow metal is expected to see more upside.
Gold 1 Hour Elliott Wave Chart
Become a Successful Trader and Master Elliott Wave like a Pro. Start your Free 14 Day Trial at - Elliott Wave Forecast.
Author

Elliott Wave Forecast Team
ElliottWave-Forecast.com


