Gold price is almost ready to rally

Enough is enough. No market can decline without correcting every now and then. And both gold and the USDX point to an upcoming reversal.
Let’s start with gold.
Is it over?
Looking at its price from a short-term point of view, we see that it paused for a brief moment at its 38.2% Fibonacci retracement level.
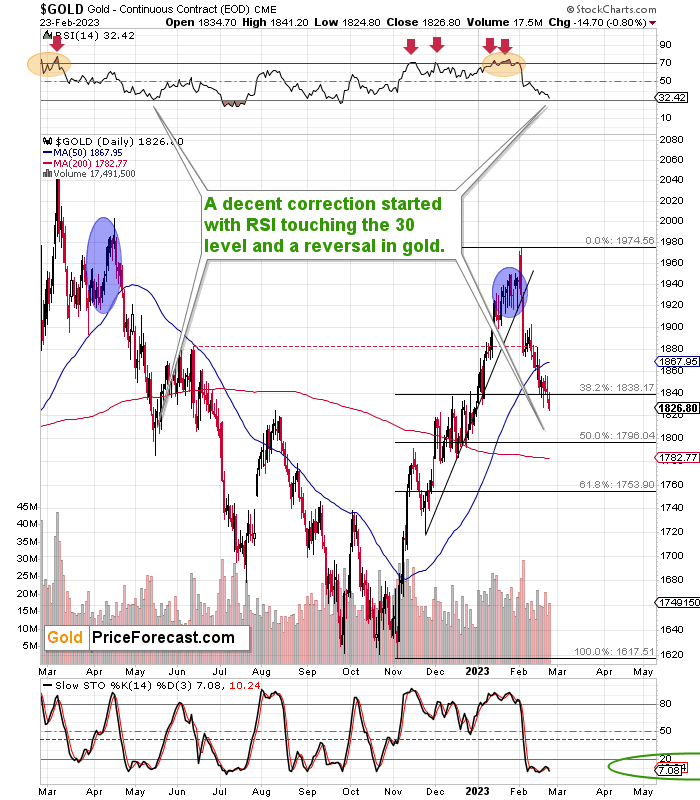
And then – after the pause – gold declined.
Not only that – it declined below the 38.2% Fibonacci retracement and below the intraday December 2022 highs. This breakdown is not confirmed, but since we did see a daily close below those levels, it’s more confirmed than it was before. Consequently, we just saw another indication that gold’s decline is not over yet.
On the other hand, if you look at the RSI indicator in the upper part of the chart, you’ll notice that it’s just above the 30 level. This means that it’s probably (if gold declines some more) about to move below 30 or right to it, thus flashing a buy signal.
As a reminder, after a similar decline (in May 2022), gold kept on declining until the RSI touched 30. We’re very close, but not there yet.
Well, to be 100% precise, the RSI is close enough to 30 to be viewed as something that might work on a near-to basis, but combining this with gold’s breakdown below the 38.2% Fibonacci retracement level makes me doubt that this is already a buy signal.
This means that what I wrote in my analysis last week remains up-to-date:
“So, will gold bottom at $1,800 or close to it? It seems quite likely.
Will this be the final bottom? It seems very unlikely given how high real interest rates have rallied recently and how far they are likely to rally in the future.
Will there be no other corrections before gold hits $1,800? It’s unclear – we might see a rebound right now given that the 38.2% Fibonacci retracement was reached, but it’s unlikely that this rebound would be big enough for most people to really care about it. Remember the late-April and early-May 2022 corrections? We might see something of similar size and length.
All in all, while the biggest opportunity lies in the junior mining stocks right now, it seems to me that gold is likely to provide us with a decline that also might be useful for those who choose to position themselves accordingly and benefit from this move.”
Let’s keep in mind that in today’s interconnected financial markets, no market can truly move on its own. In particular, gold (well, it’s the same with silver and miners, too) can’t really move independently from the currency that it’s most often priced in – the U.S. dollar.
In fact, the U.S. dollar is one of the key fundamental drivers of gold prices (the other is the situation in real interest rates – which I discussed at the beginning of February).
Where is the Dollar going?
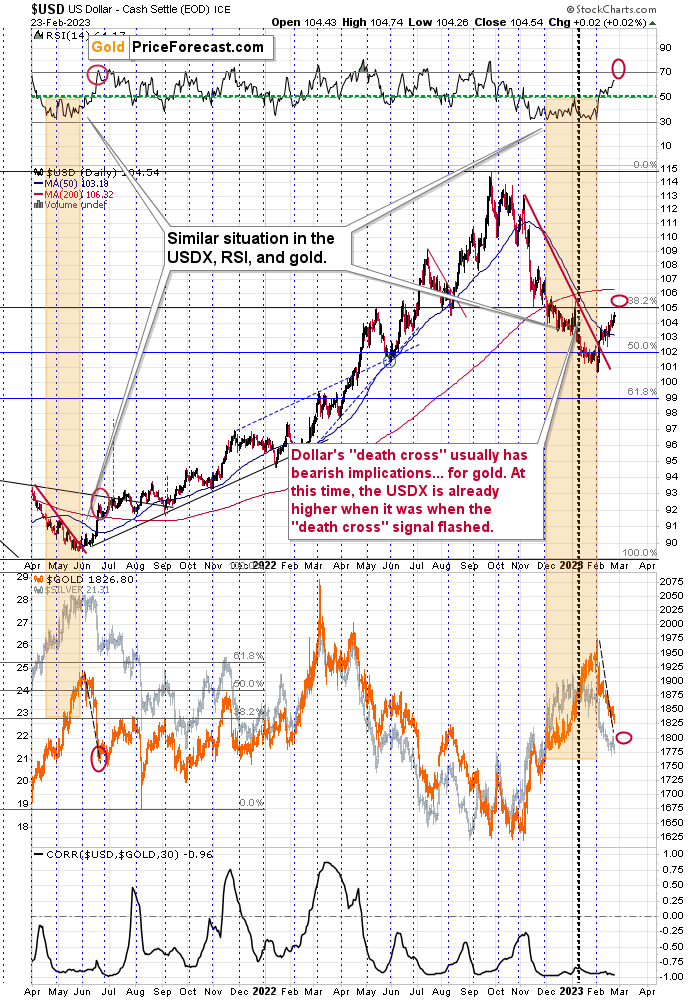
The USD Index has been on the rise this month after bottoming practically right at its cyclical turning point. As a reminder, the USDX tends to reverse close to the turn of the month (please note the dotted, vertical lines). This is not only important. It’s also timely.
The end of the month is just a few sessions away, which suggests that the USD Index might want to reverse its direction soon. The most recent move was to the upside, which would indicate that the next reversal will be a top.
Of course, this doesn’t indicate a change in the medium-term trend, which is likely to remain up, but it does point to a good possibility of seeing a pullback shortly.
This is particularly the case, given the similarity to what happened in mid-2021. I marked those areas with orange rectangles.
These were the times (now and then) when the USD Index declined while the RSI based on it moved between 30 and 50, and at the same time gold continued to rally. Then, after USDX’s bottom (and gold’s top), it kept on rallying until the RSI indicator moved to the 70 level. It was then that we saw a short-term top (and a short-term bottom in gold).
Interestingly, we have a resistance level nearby – the yearly top. It’s at 105.50 (the intraday high) and 104.83 (the daily close). Since currencies trade around the clock, it seems to me that intraday price extremes are more important than it in other markets, where closing prices matter quite a lot.
This means that it would be quite in line with mid-2021 if the USD Index moved up a bit more and topped close to the end of the month and close to the 105.50 level. This would likely make the RSI move higher (and perhaps touch the 70 level), too.
Moreover, please note that the size of the decline in gold (lower part of the chart, orange line) that we saw in 2021 (to the initial bottom) copied to the current situation points to a move in gold just a little lower before we see the final bottom – perhaps to $1,800 or so. Of course, this is in line with what the gold chart itself is “suggesting.”
All in all, it seems that even though the precious metals sector is still likely to move lower over the following months, we’re quite likely about to see a counter-trend rally. This rally is likely to provide a great opportunity for some traders (especially, if one focuses on mining stocks), but please make sure that trading such a move is in line with your overall strategy – not all moves are worth trading, after all.
Want free follow-ups to the above article and details not available to 99%+ investors? Sign up to our free newsletter today!
Want free follow-ups to the above article and details not available to 99%+ investors? Sign up to our free newsletter today!
Author

Przemyslaw Radomski, CFA
Gold Price Forecast
Przemyslaw Radomski, CFA (PR) is a precious metals investor and analyst who takes advantage of the emotionality on the markets, and invites you to do the same. His company, Sunshine Profits, publishes analytical software that any


