Gold Price Forecast: XAUUSD heading towards $1,600 amid risk-off flows

XAUUSD Current price: $1,638.11
- Central banks' monetary policy decisions keep investors on the sidelines.
- Tepid Chinese data undermined demand for high-yielding assets and backed the dollar.
- XAUUSD aims to extend its slump towards the year low at $1,614.81 a troy ounce.
Spot gold fell to $1,633.37 a troy ounce at the beginning of the week as a dismal market mood fueled demand for the American currency. The initial catalyst came from China, as local data showed that the economy contracted further in October as the zero-covid policy keeps millions of citizens under strict lockdown.
Investors also turned cautious amid upcoming first-tier events. Several central banks, the US Federal Reserve included, will announce their monetary policy decisions. The Reserve Bank of Australia will open the central banks’ calendar on Tuesday and is expected to announce a modest 25 bps rate hike despite inflation jumping to a two-decade high in the third quarter of the year. The Bank of England will have a Super Thursday, with the latest political turmoil in the United Kingdom generating uncertainty on what Governor Andrew Bailey and co can do this time.
Wall Street trades in the red but off early lows as European indexes managed to shrug off the negative stance and closed with modest gains. Bouncing equities are limiting the dollar demand mid-US session.
XAUUSD price short-term technical outlook
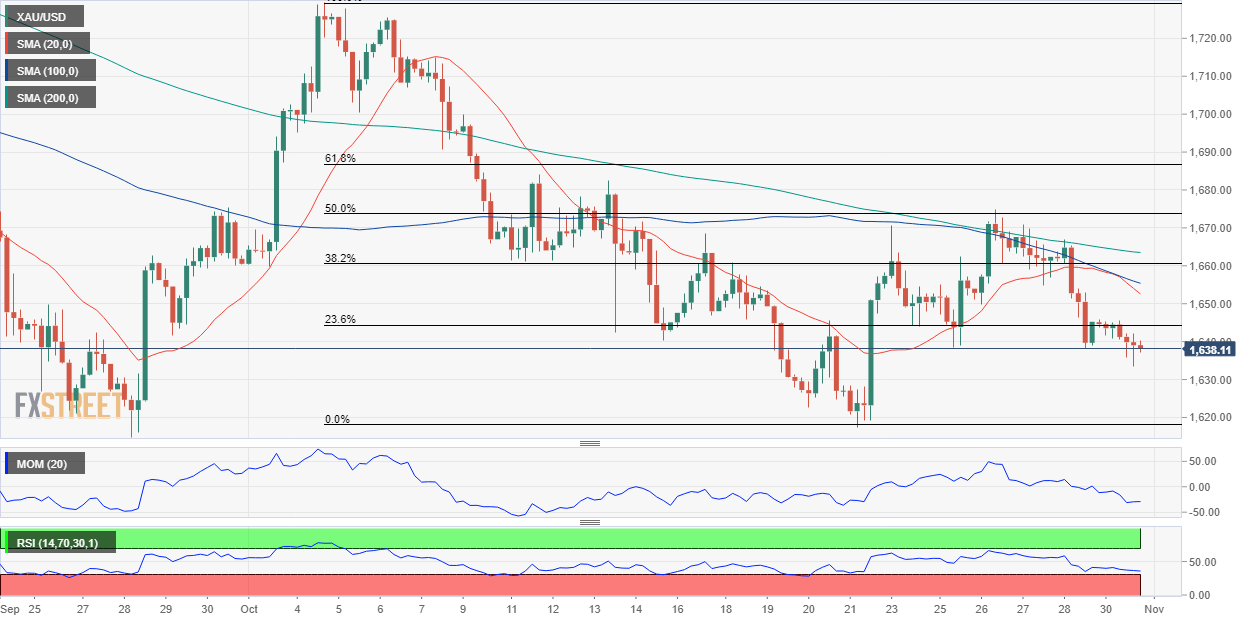
The bright metal trades at its lowest in six days, currently around $1,638. Gold met sellers around a Fibonacci level, the 23.6% retracement of the $1,729.54/$1,617.12 decline at $1,643.60. XAUUSD daily chart shows that the 20 SMA turns south above the current level and below bearish longer ones as technical indicators grind lower within negative levels, skewing the risk to the downside.
In the near term, and according to the 4-hour chart, technical readings favor a downward extension. The pair trades below bearish moving averages, with the 20 SMA accelerating south below the longer ones. Additionally, technical indicators consolidate below their midlines without clear directional strength. The metal has room to extend its slump towards the year’s low at $1,614.81 as long as the aforementioned Fibonacci resistance level keeps attracting sellers.
Support levels: 1,627.65 1,617.10 1,605.00
Resistance levels: 1,643.60 1,654.70 1,665.70
Premium
You have reached your limit of 3 free articles for this month.
Start your subscription and get access to all our original articles.
Author

Valeria Bednarik
FXStreet
Valeria Bednarik was born and lives in Buenos Aires, Argentina. Her passion for math and numbers pushed her into studying economics in her younger years.