XAUUSD Current price: $1,717.15
- Tepid US employment-related data and month-end flows weighed on the greenback.
- US Treasury yields eased from their recent highs but remain at the upper end of their monthly range.
- XAUUSD is technically bearish, although losing downward momentum in the near term.
Spot gold fell to a fresh monthly low of $1,709.61 a troy ounce, maintaining the red but off the mentioned low at the time being. The dollar surged throughout the first half of the day but lost steam following the release of tepid US employment-related data. The ADP report showed that the private sector added 132K new job positions in August, much worse than the 288K expected and below the previous 270K.
The greenback is also suffering from month-end flows, but the pullback has been quite limited, somehow suggesting that dollar buyers are far from done. US Treasury yields are retreating from their early highs but holding at the upper end of their latest range, with the 10-year note currently yielding 3.11%. Wall Street, in the meantime, struggles to turn green, with the major indexes seesawing around their opening levels.
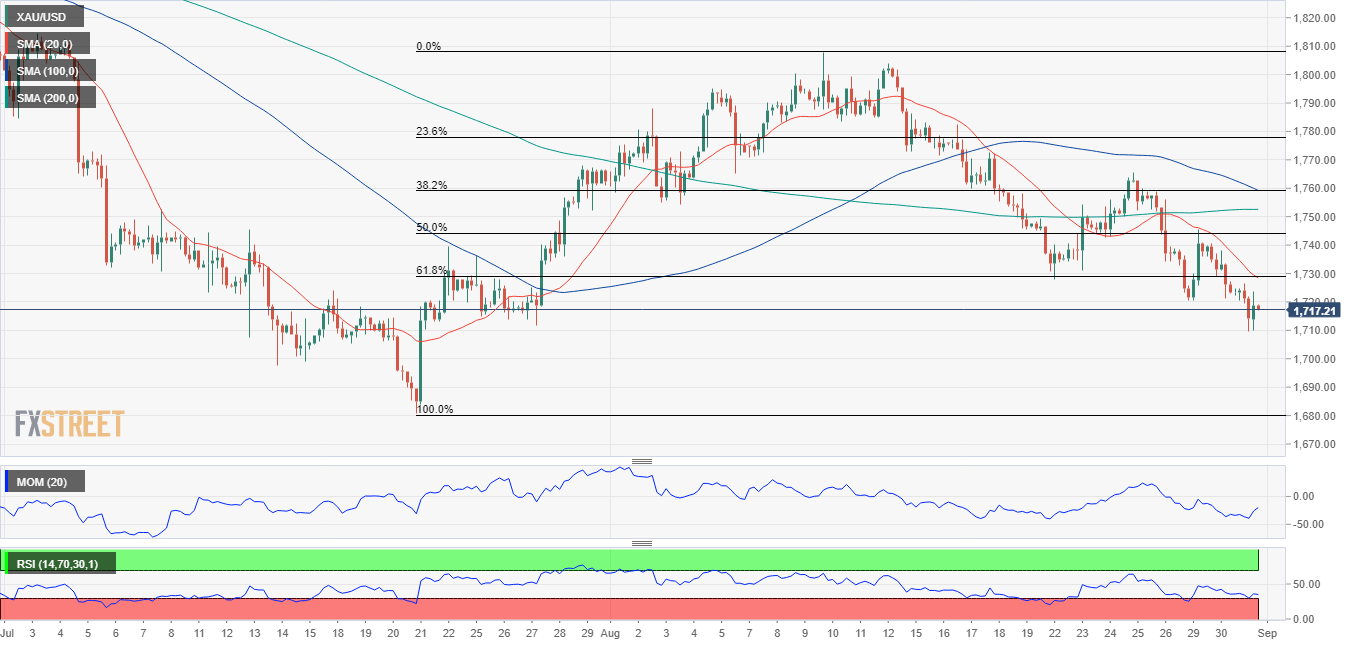
Gold price short-term technical outlook
XAUUSD is closing a fifth consecutive month with sharp losses and is about to confirm a long-term double-top pattern. The pair reached record highs in the $2,070 price zone in August 2020 and March 2022, while in between, it posted relevant lows in the $1,670 area, which is now the neckline of the figure. A clear break below it should imply a $400 slump.
Technical readings in the daily chart favor the downside, although indicators are losing their bearish strength near oversold readings, suggesting the bright metal may soon correct some of its recent losses. Nevertheless, it remains well below bearish moving averages, also below the 61.8% retracement of its latest daily rally at $1,729.25, the immediate resistance level.
In the 4-hour chart, technical indicators aim higher within negative levels, reflecting the ongoing near-term recovery, but falling short of suggesting further gains. The 20 SMA has extended its decline and now converges with the aforementioned Fibonacci resistance, reinforcing it.
Support levels: 1,703.90 1,692.35 1,684.00
Resistance levels: 1,729.25 1,744.20 1,759.20
Information on these pages contains forward-looking statements that involve risks and uncertainties. Markets and instruments profiled on this page are for informational purposes only and should not in any way come across as a recommendation to buy or sell in these assets. You should do your own thorough research before making any investment decisions. FXStreet does not in any way guarantee that this information is free from mistakes, errors, or material misstatements. It also does not guarantee that this information is of a timely nature. Investing in Open Markets involves a great deal of risk, including the loss of all or a portion of your investment, as well as emotional distress. All risks, losses and costs associated with investing, including total loss of principal, are your responsibility. The views and opinions expressed in this article are those of the authors and do not necessarily reflect the official policy or position of FXStreet nor its advertisers. The author will not be held responsible for information that is found at the end of links posted on this page.
If not otherwise explicitly mentioned in the body of the article, at the time of writing, the author has no position in any stock mentioned in this article and no business relationship with any company mentioned. The author has not received compensation for writing this article, other than from FXStreet.
FXStreet and the author do not provide personalized recommendations. The author makes no representations as to the accuracy, completeness, or suitability of this information. FXStreet and the author will not be liable for any errors, omissions or any losses, injuries or damages arising from this information and its display or use. Errors and omissions excepted.
The author and FXStreet are not registered investment advisors and nothing in this article is intended to be investment advice.
Recommended Content
Editors’ Picks
AUD/USD bulls eye 0.6660 resistance confluence and RBA Interest Rate Decision

AUD/USD bulls take a breather around 0.6620, making rounds to a two-week high amid Tuesday’s sluggish session as Aussie pair traders await the Reserve Bank of Australia’s (RBA) Interest Rate Decision. The quote remains sidelined after rising in the last three consecutive days.
EUR/USD struggles to defend corrective bounce off 1.0700

EUR/USD retreats towards 1.0700 amid the early hours of Tuesday’s Asian session after a volatile day. That said, the Euro pair initially cheered the downbeat US data before paring the gains and closing the day around the week-start levels.
Gold grinds higher past $1,950 amid downbeat United States data

Gold stays on the front foot aroud $1,961, after an upbeat start of the week, as the bullion traders seek more clues to extend the latest rebound during early Tuesday in Asia. The precious metal cheered downbeat United States statistics and dicey markets to regain upside momentum the previous day.
TRX, ADA price fall over 5% as Tron and Cardano founders show support for Binance and CEO

Tron (TRX) and Cardano (ADA) prices are down by more than 5% each as the two altcoins follow in the footsteps of Binance Coin (BNB), which fell 10% after the US Securities and Exchange Commission (SEC) filed a civil complaint against Binance and CEO Changpeng Zhao (CZ).
Reserve Bank of Australia Preview: AUD/USD ready for another hike? Premium

The Reserve Bank of Australia (RBA) is set to announce its monetary policy decision on Tuesday, June 6 at 04:30 GMT. The market consensus is for the central bank to keep its monetary policy unchanged.