Gold Price Forecast: XAU/USD turns cautious again ahead of US inflation test
- Gold price reverses the rebound from weekly lows early Friday as US PCE inflation data awaited.
- The US Dollar swings higher after US courts’ drama on Trump’s tariffs, likely US-Japan trade talks.
- Gold price defends critical support line, remains exposed to two-way risks on tariff headlines and US PCE data.

Gold price is back in the red early Friday, giving up a part of the previous rebound from weekly lows near $3,245. The fate of Gold price now hinges on the US core Personal Consumption Expenditure (PCE) Price Index and tariff headlines.
Gold price dips after Thursday’s two-way businesses
The US Dollar (USD) danced to the tunes of the American courts‘ rulings on President Donald Trump’s "Liberation Day" tariffs.
On Wednesday, a US Court of International Trade (UCIT) blocked Trump's "Liberation Day" tariffs from going into effect, which bolstered the USD recovery at the expense of the Gold price.
The sentiment around the Greenback was also underpinned by intense risk flows as markets cheered tariff ruling and the encouraging earnings report from the American artificial intelligence (AI) pioneer Nvidia.
However, Gold buyers jumped in during the American session as the US Dollar came under heavy selling pressure after the US Court of Appeals for the Federal Circuit in Washington said it was pausing the lower court's ruling to consider the government's appeal, and ordered the plaintiffs in the cases to respond by June 5 and the administration by June 9, per Reuters.
Additionally, White House Advisor Peter Navarro’s comments also exacerbated the USD’s pain, aiding the Gold price upswing. Responding to the UCIT’s ruling, Navarro said, “you can assume even if we lose tariff cases we'll do it another way.”
Thursday’s disappointing Jobless Claims and Pending Home Sales further contributed to the Greenback’s steep decline.
Tariff and trade headlines continue to dominate risk sentiment and the USD price action this Friday, with the Greenback attempting to recover the early dip spurred by a Wall Street Journal (WSJ) report.
Citing people familiar with the matter, the WSJ reported late Thursday that “US President Donald Trump's administration is considering an existing law that includes language allowing for tariffs of up to 15% for 150 days.”
The renewed US Dollar uptick snaps the Gold price rebound heading into the US PCE inflation test. The Fed’s preferred inflation measure, the annual core Personal Consumption Expenditure (PCE) Price Index, is set to rise 2.5% in April after reporting a 2.6% growth in March.
A bigger-than-expected cooldown in the inflation data could pour cold water on the Fed’s recent hawkish stance and likely trigger a fresh pullback in the USD, allowing Gold price to resume the recovery from weekly troughs.
In the meantime, Gold traders will remain cautious and refrain from placing fresh positions in the bright metal, bracing for some volatility on the PCE data release.
Gold price technical analysis: Daily chart
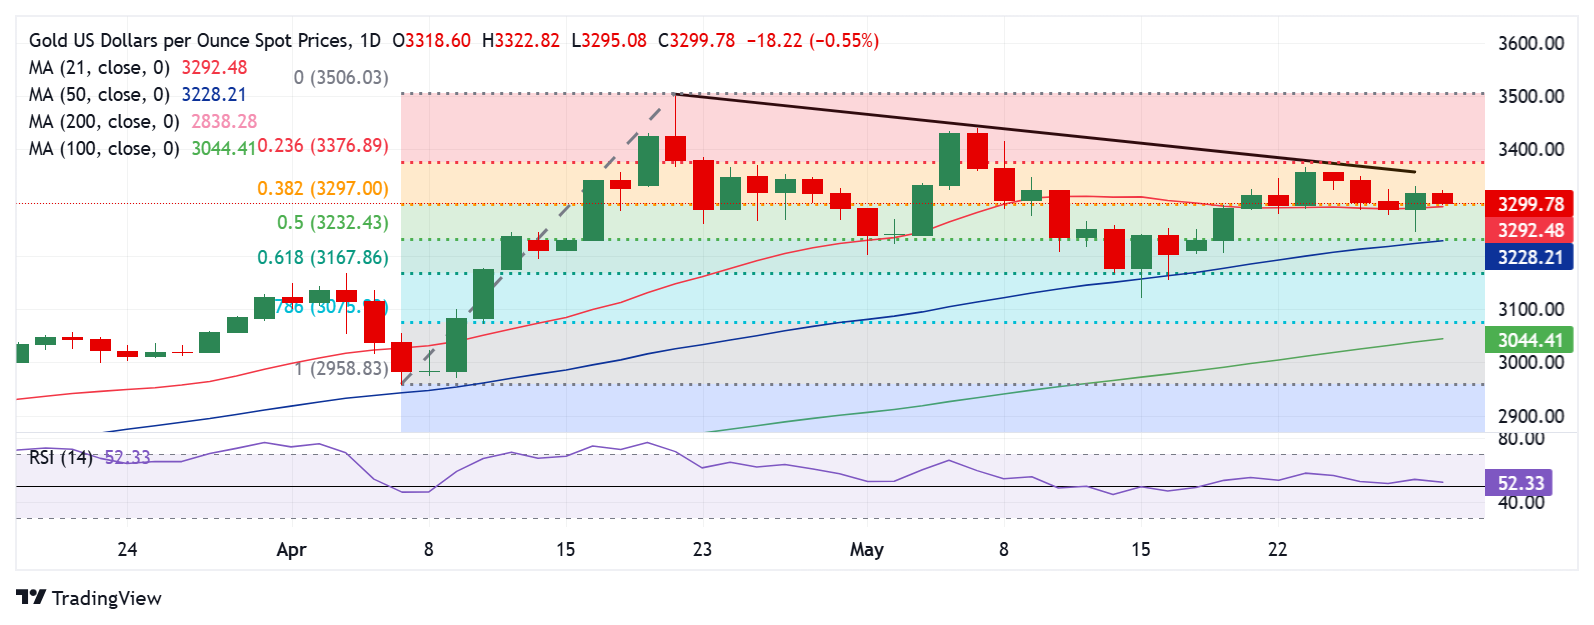
Gold price managed to recapture the critical 21-day Simple Moving Average (SMA) on a daily candlestick closing basis, now at $3,292.
The 38.2% Fibonacci Retracement (Fibo) level of the April record rally aligns near that level.
Meanwhile, the 14-day Relative Strength Index (RSI) also moved back above the midline, currently near 52.28, reviving the bullish bias in the near term.
As it is positioned ahead of the US inflation data, Gold price remains exposed to two-way risks.
If the midline flips bearish alongside a weekly closing below the abovementioned strong support area, Gold sellers could accelerate declines toward the 50% Fibo level near $3,230, where the 50-day SMA closes in.
A daily candlestick closing below that level could put the focus back on the 61.8% Fibo support at $3,168, from where Gold price rebounded to two-week highs of $3,366 last week.
On the other hand, if Gold price holds the 21-day SMA at $3,292 yet again on a sustained basis, the rebound could target the previous day’s high of $3,33, followed by the $3,350 psychological level.
Economic Indicator
Core Personal Consumption Expenditures - Price Index (YoY)
The Core Personal Consumption Expenditures (PCE), released by the US Bureau of Economic Analysis on a monthly basis, measures the changes in the prices of goods and services purchased by consumers in the United States (US). The PCE Price Index is also the Federal Reserve’s (Fed) preferred gauge of inflation. The YoY reading compares the prices of goods in the reference month to the same month a year earlier. The core reading excludes the so-called more volatile food and energy components to give a more accurate measurement of price pressures." Generally, a high reading is bullish for the US Dollar (USD), while a low reading is bearish.
Read more.Next release: Fri May 30, 2025 12:30
Frequency: Monthly
Consensus: 2.5%
Previous: 2.6%
Source: US Bureau of Economic Analysis
After publishing the GDP report, the US Bureau of Economic Analysis releases the Personal Consumption Expenditures (PCE) Price Index data alongside the monthly changes in Personal Spending and Personal Income. FOMC policymakers use the annual Core PCE Price Index, which excludes volatile food and energy prices, as their primary gauge of inflation. A stronger-than-expected reading could help the USD outperform its rivals as it would hint at a possible hawkish shift in the Fed’s forward guidance and vice versa.
Author

Dhwani Mehta
FXStreet
Residing in Mumbai (India), Dhwani is a Senior Analyst and Manager of the Asian session at FXStreet. She has over 10 years of experience in analyzing and covering the global financial markets, with specialization in Forex and commodities markets.

















