Gold Price Forecast: XAU/USD steady around $1,950 as the Fed looms

XAU/USD Current price: $1,955.17
- More signs of easing United States inflation fuel optimism on Wednesday.
- The US Federal Reserve will announce its monetary policy decision, publish fresh projections.
- XAU/USD could react to Fed surprises but will hardly move if the central bank fails to impress.
XAU/USD holds on to modest intraday gains, trading within familiar levels in the $1,950 price zone. Investors’ mood improved these days, following United States (US) inflation-related figures supporting a dovish Federal Reserve (Fed). On the one hand, the Consumer Price Index (CPI) rose at a slower-than-anticipated pace in May, up by a modest 0.1% MoM in May. On the other, the Producer Price Index (PPI) contracted by 0.3% in the same month. The soft numbers somehow confirm price pressures are on the downward path and that the aggressive monetary policy adopted by the Fed in March 2022 is paying off.
In such a scenario, the expected end of the monetary tightening cycle seems logical, despite signs the labor market remains tight, which may end up pushing inflation back higher. Nevertheless, considering the ongoing pressure on the financial system, United States policymakers have anticipated a more dovish approach and a meeting-by-meeting decision.
At this point, the Fed is expected to hold its fire this time. The central bank today will not only announce its monetary policy but also offer fresh economic projections in the form of a dot plot, which usually anticipates future rate movements. Furthermore, Chairman Jerome Powell will deliver a press conference to explain their decision. The focus, then, will be on the dot plot and potential rate cuts in the future, coupled with Powell’s view of the overall situation.
Financial markets are optimistic a more conservative Fed would help the economy dodge a recession. As a result, investors are looking for high-yielding assets and leaving XAU/USD aside for now. Nevertheless, if the Fed decides differently from what financial markets anticipate, some wild price action could be expected, with XAU/USD responding to the broad USD Dollar’s weakness/strength.
XAU/USD price short-term technical outlook
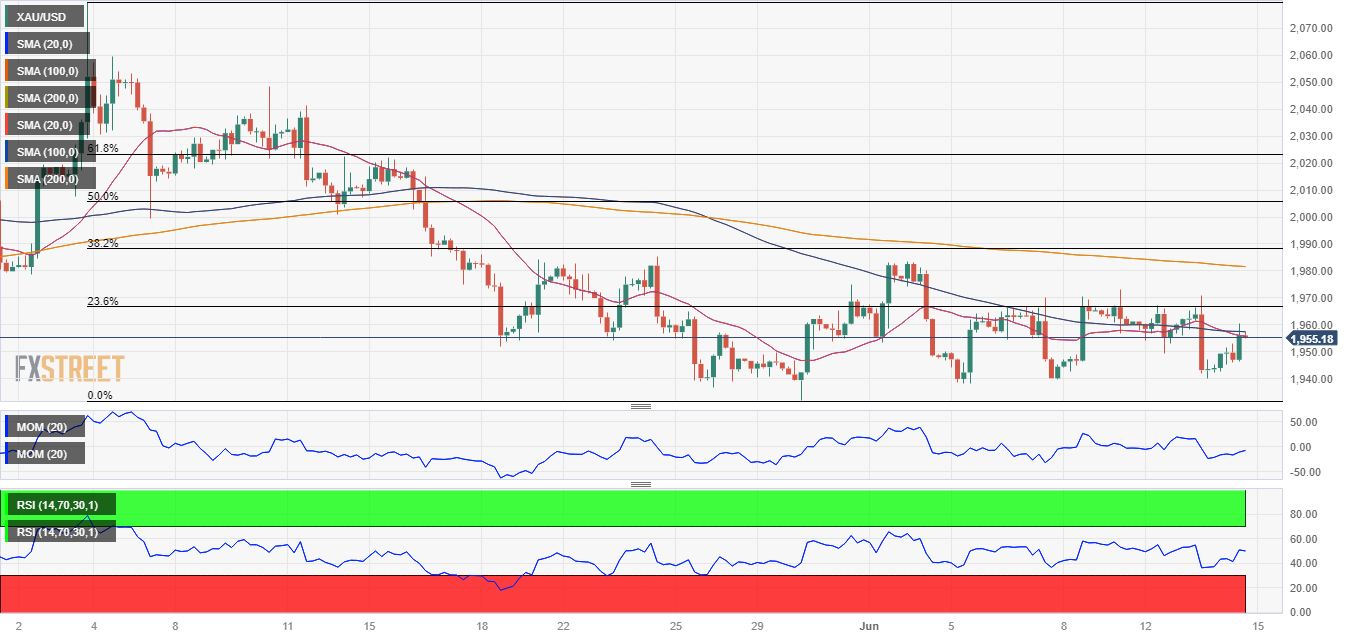
The daily chart for the XAU/USD pair shows it holds on to most of its intraday gains, although it is still below its weekly opening. It has continuously met buyers around a directionless 100 Simple Moving Average (SMA) at $1,941.60, while it bottomed at $1,932.00 in May, the levels to watch to the downside. At the same time, the pair is unable to advance beyond a mildly bullish 20 SMA, which loses its bearish strength. Finally, technical indicators turned higher, but remain within neutral levels, falling short of anticipating another leg north.
The near-term picture is neutral-to-bearish. The 4-hour chart shows that XAU/USD develops below its 100 and 200 SMAs while hovering around a bearish 20 SMA. At the same time, the Momentum indicator heads marginally lower below its midline, while the Relative Strength Index (RSI) indicator remains directionless around its 50 line, reflecting the absence of speculative interest. Gold has a solid static resistance level at $1,966.20, the 23.6% retracement of the latest daily decline.
Support levels: 1,941.60 1,932.00 1,918.70
Resistance levels: 1.966.20 1,972.00 1,987.65
Author

Valeria Bednarik
FXStreet
Valeria Bednarik was born and lives in Buenos Aires, Argentina. Her passion for math and numbers pushed her into studying economics in her younger years.


