Gold Price Forecast: XAU/USD set to test $1700? Daily close below 61.8% Fib level flags caution
- Gold price attempts a bounce but not out of the woods yet.
- USD retreats with Treasury yields amid China-led risk-aversion.
- Gold’s daily technical setup remains in favor of the bearish traders.

Gold price extended the previous weakness and lost nearly $15 to refresh seven-week lows at $1728 on Tuesday but recovered to $1734 at the close. The sell-off in gold price could be mainly attributed to the surge in the US Treasury yields across the curve, with propelled the US dollar to ten-month tops vs. its main competitors.
The hawkish shifts in the Fed’s monetary policy stance combined with the recent tapering calls by the Fed officials and rising inflation expectations drove the yields through the roof, weighing heavily on the non-interest-bearing gold. The benchmark 10-year Treasury yields hit three-month highs at 1.56%, reflective of the market’s bet on a sooner-than-expected interest rate hike. St. Louis Fed President James Bullard said warned over high inflation while calling for two rate hikes in 2022. Atlanta Fed Chief Raphael Bostic noted that the economic recovery is at full steam, thus warranting tapering in the coming months.
The drop in the US CB Consumer Confidence data and slide in Wall Street indices has little to no impact on gold price, as it remained at the mercy of the Fed sentiment.
In Wednesday’s trading so far, gold is attempting a minor bounce towards $1750, as the US Treasury yields have pulled back from multi-month highs, dragging the greenback lower. A renewed risk-aversion wave has gripped the Asian markets, as investors take cues from Wall Street overnight while dual China worries temper investors’ sentiment. Markets have received no word on the troubled Evergrande group’s offshore repayment due on Wednesday. Meanwhile, China’s power supply shortage is raising concerns over the economic recovery. The worsening market mood seems to have somewhat revived the demand for the US government bonds, offering temporary relief to gold buyers. However, the further upside appears elusive, as traders will remain cautious ahead of a slew of speeches by the global central banks’ Governors, including Fed Chair Powell, ECB President Lagarde and BOE Chief Bailey, at the ECB’s online forum.
Gold Price Chart - Technical outlook
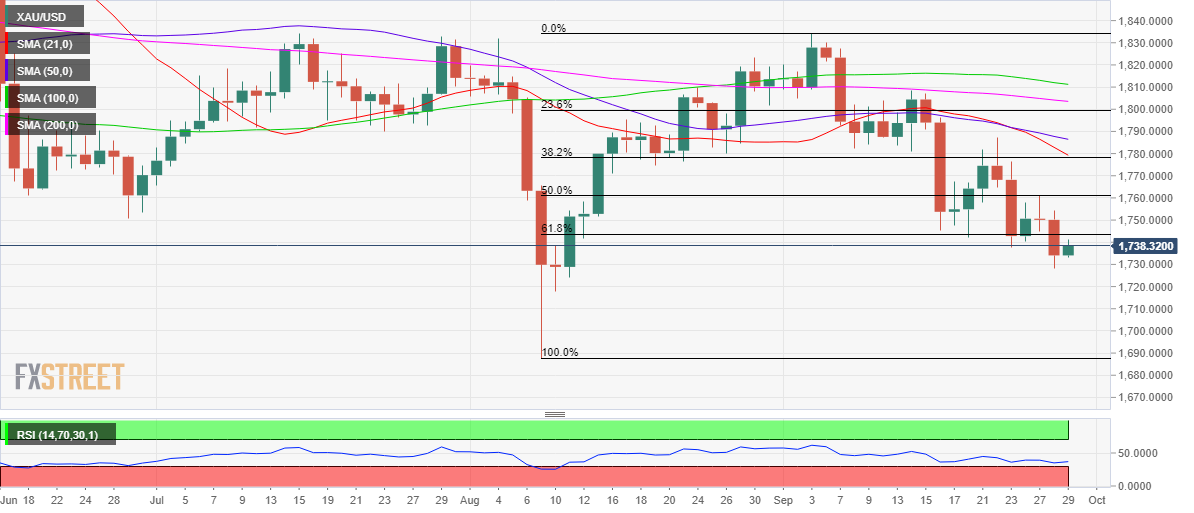
Gold: Daily chart
Gold’s daily chart shows that the price closed below $1744, the 61.8% Fibonacci Retracement level of the recovery from the August lows of $1688 to the September 3 highs of $1834.
The 14-day Relative Strength Index (RSI) has edged slightly higher but remains well below the central line, suggesting the downside momentum remains well in place.
Therefore, any rebound is likely to remain short-lived and could be seen as a good opportunity for the sellers to create fresh entries.
The next downside target is seen at the August 10 low of $1718, below which the $1700 mark will get tested.
If the selling pressure remains unabated, then gold price could fall further towards the August lows.
Alternatively, a daily closing above the 61.8% Fib level is critical to unleashing any meaningful recovery towards $1750.
Gold bulls will then face stiff resistance at the 50% Fib level of the same advance at $1761.
Further up, the confluence of the 38.2% Fib level and the bearish 21-Daily Moving Average (DMA) at $1778 will emerge as the next critical hurdle for gold bulls.
Author

Dhwani Mehta
FXStreet
Residing in Mumbai (India), Dhwani is a Senior Analyst and Manager of the Asian session at FXStreet. She has over 10 years of experience in analyzing and covering the global financial markets, with specialization in Forex and commodities markets.


