Gold Price Forecast: XAU/USD nears $2,600 amid persistent USD demand

XAU/USD Current price: $2,615.59
- Chinese inflation-related data undermined the market mood at the beginning of the week.
- The United States (US) will release the October Consumer Price Index next Wednesday.
- XAU/USD could keep falling sub-$2,600 despite near-term oversold conditions.
Spot Gold fell throughout the Asian and European sessions as demand for the US Dollar continues following last week's United States (US) events. Former President Donald Trump’s victory in the 2024 election and signs that Republicans will take full control of Congress fueled the USD amid hopes the upcoming government will strengthen the local currency. Even further, the Federal Reserve (Fed) announced a modest 25 basis points (bps) interest rate cut, sticking to its path without showing concerns about the economy’s performance.
Beyond US developments, market players are paying close attention to what’s happening in China. Inflation, as measured by the Consumer Price Index (CPI) resulted negative in October, posting a -0.3% MoM. Furthermore, the annualized Producer Price Index (PPI) declined 2.9% in October, fueling deflation-related concerns.
Data-wise, the macroeconomic calendar had nothing relevant to offer, with investors awaiting the US October CPI, scheduled for release next Wednesday. US inflation, at this point, may be irrelevant, considering investors are looking at whatever the new government will bring to the world’s largest economy.
XAU/USD short-term technical outlook
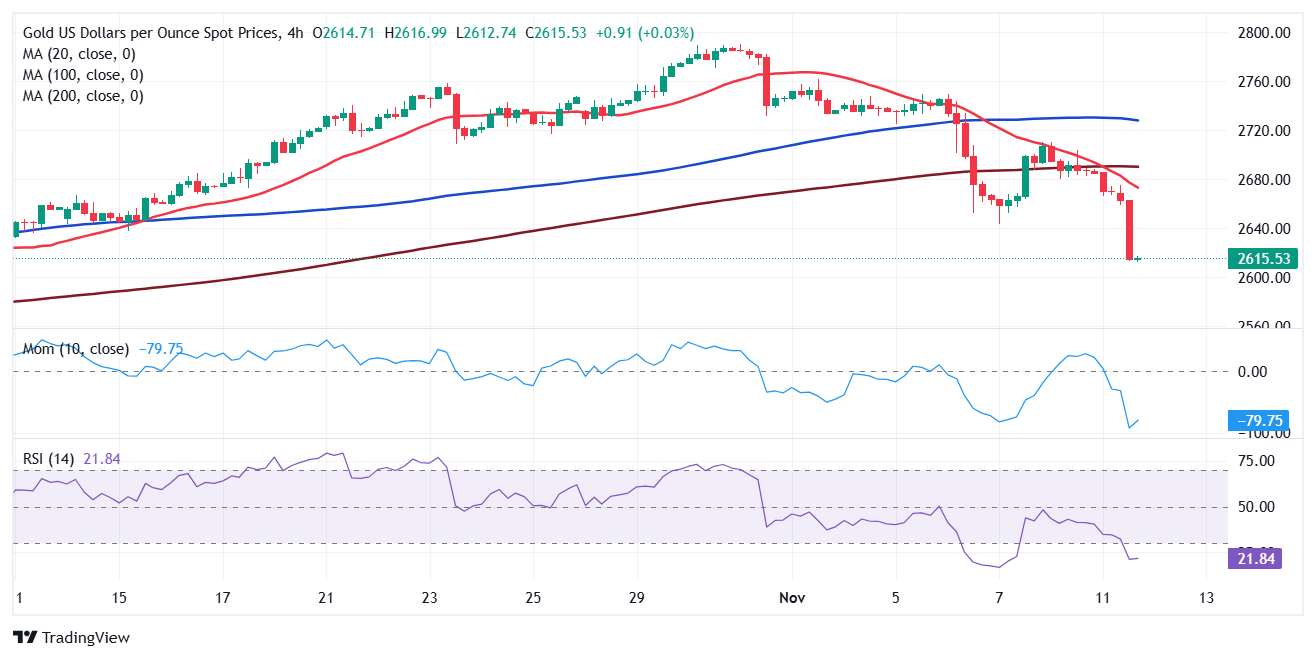
From a technical point of view, XAU/USD is poised to extend its slump. The bright metal trades near the $2,600 mark and at fresh one-month lows. In the mentioned time frame, Gold develops well below a now flat 20 Simple Moving Average (SMA), while the 100 and 200 SMAs head firmly north far below the current level. Additionally, technical indicators head south almost vertically, well below their midlines, reflecting the strong selling interest.
The near-term technical picture suggests XAU/USD will extend its slide. In the 4-hour chart, a bearish 20 SMA accelerated south after crossing below a flat 200 SMA while providing intraday resistance around the daily high. At the same time, the Momentum indicator heads south almost vertically, while the Relative Strength Index (RSI) indicator maintains its downward slope at around 23 without signs of downward exhaustion.
Support levels: 2,601.90 2,588.70 2,572.45
Resistance levels: 2,627.10 2,639.05 2,651.00
Premium
You have reached your limit of 3 free articles for this month.
Start your subscription and get access to all our original articles.
Author

Valeria Bednarik
FXStreet
Valeria Bednarik was born and lives in Buenos Aires, Argentina. Her passion for math and numbers pushed her into studying economics in her younger years.


