Gold Price Forecast: XAU/USD is down but not out, awaits US Durable Goods
- Gold price extends the previous drop following rejection at 200-DMA.
- The risk tone worsens, aids the USD recovery ahead of key US data.
- Upside risks remain intact for gold price despite the two-day downtrend.

Gold price failed to extend its Monday’s rebound and fell on Tuesday, posting modest losses. The yellow metal managed to survive above the $1800 mark despite the pullback from fresh three-week highs of $1810 reached in the first half of Tuesday’s trading session. Gold price, initially, benefitted from a broadly weaker US dollar, as easing Fed’s tapering fears, rebound in the Chinese tech stocks and Pfizer/ BioNtech’s COVID-19 vaccine approval lifted the overall market mood. However, the risk-on sentiment-led rally in the US Treasury yields and stocks snapped gold’s rebound and knocked off the rates back towards the $1800 threshold. A lack of first-tier US macro news also failed to provide any trading impetus to gold price.
In the run-up to the US Durable Goods Orders release due later in Wednesday’s American trading, gold price is extending the previous retreat from multi-week highs. Gold price falls back below the $1800 barrier, at the press time, feel the pull of gravity amid a broad rebound in the US dollar across the board. The safe-haven demand for the dollar re-emerged, as the market mood worsens amid a pause in the Chinese tech stocks rebound and escalating concerns over the rapid spread of the highly contagious Delta covid variant. Also, investors turn cautious ahead of the first top-tier US economic data for this week – the Durable Goods Orders, which are expected to drop 0.3% in July vs. +0.9% seen previously. Disappointing data could further cool off the Fed’s tapering expectations, coming to the rescue of gold price. Although the sentiment on Wall Street and US dollar price action will continue to lead the way for gold amid US stimulus talks and ahead of the all-important Fed’s Jackson Hole Symposium, starting this Thursday.
Gold Price Chart - Technical outlook
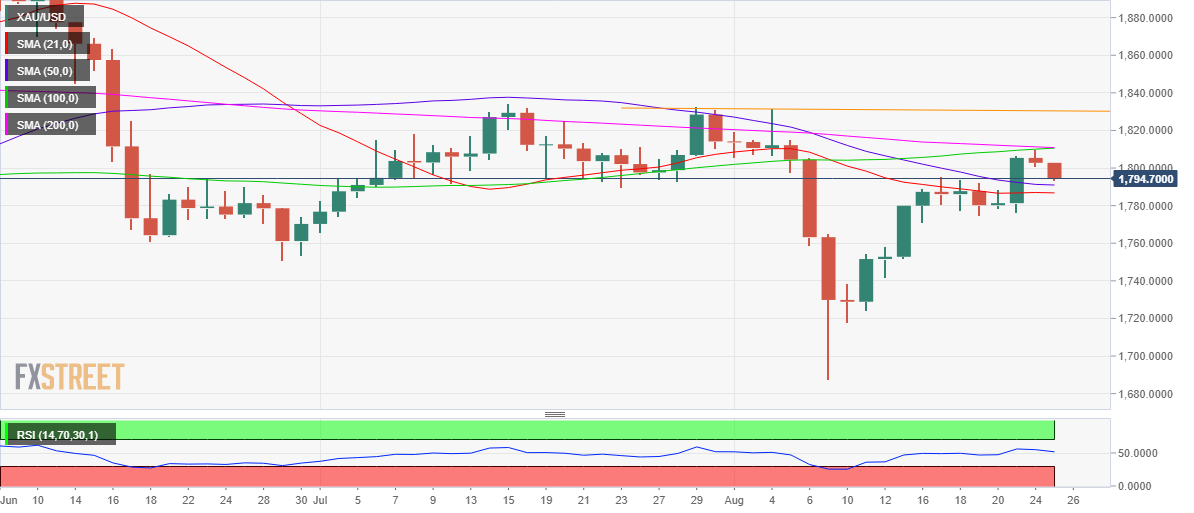
Gold: Daily chart
The daily chart clearly shows that gold price faced rejection at the 200-Daily Moving Averages (DMA) at $1810 on Tuesday. At that point, the 100-DMA now coincides.
Sellers returned, thereafter, knocking off gold price towards the horizontal 50-DMA at $1791.
As of writing, gold price remains locked between the key moving averages, awaiting a clear break in either direction.
However, with the 14-day Relative Strength Index (RSI) still holding above the midline and a potential bull cross, the upside breakout appears more likely for gold traders.
The 100-DMA is on the verge of cutting the 200-DMA from below, which if materialized would validate a bullish crossover.
Acceptance above the aforesaid strong resistance at $1810 could likely unleash additional gains towards the $1820 round figure. The buyers will then target the August highs of $1832.
If the downside pressure accelerates, below a break of the 50-DMA cushion, then the horizontal 21-DMA at $1787 could challenge the bearish commitments.
Monday’s low of $1777 will be back in play should the bears flex their muscles.
Author

Dhwani Mehta
FXStreet
Residing in Mumbai (India), Dhwani is a Senior Analyst and Manager of the Asian session at FXStreet. She has over 10 years of experience in analyzing and covering the global financial markets, with specialization in Forex and commodities markets.


