Gold Price Forecast: XAU/USD hovers around $3,250 as optimism persists

XAU/USD Current price: $3,252.75
- An upbeat market mood weighs on the US Dollar, providing near-term support to XAU/USD.
- The United States Consumer Price Index rose by less than anticipated in April.
- XAU/USD shows a limited bullish potential in the near term, support at $3,225.
Spot Gold consolidates losses on Tuesday, holding above the $3,200 mark yet unable to recover the ground lost on Monday. Financial markets retain the positive mood triggered by news of de-escalating trade tensions between the United States (US) and China, as both countries agreed to reduced tariffs on each other for 90 days.
Other than that, the US released the April Consumer Price Index (CPI), which rose by 2.3% compared to a year earlier, easing from the previous 2.4%. The core annual reading, in the meantime, remained unchanged at 2.8%. Finally, the monthly CPI was up 0.2%, above the previous -0.1% but below the 0.3% anticipated by market players.
The upbeat mood weighed on the Greenback, leading to a modest XAU/USD advance. Meanwhile, Wall Street trades mixed. The Dow Jones Industrial Average is down roughly 0.40%, still positive for the week after adding over 1,000 points on Monday. The Nasdaq Composite and the S&P 500 post intraday gains, with the latter turning positive for the year.
XAU/USD short-term technical outlook
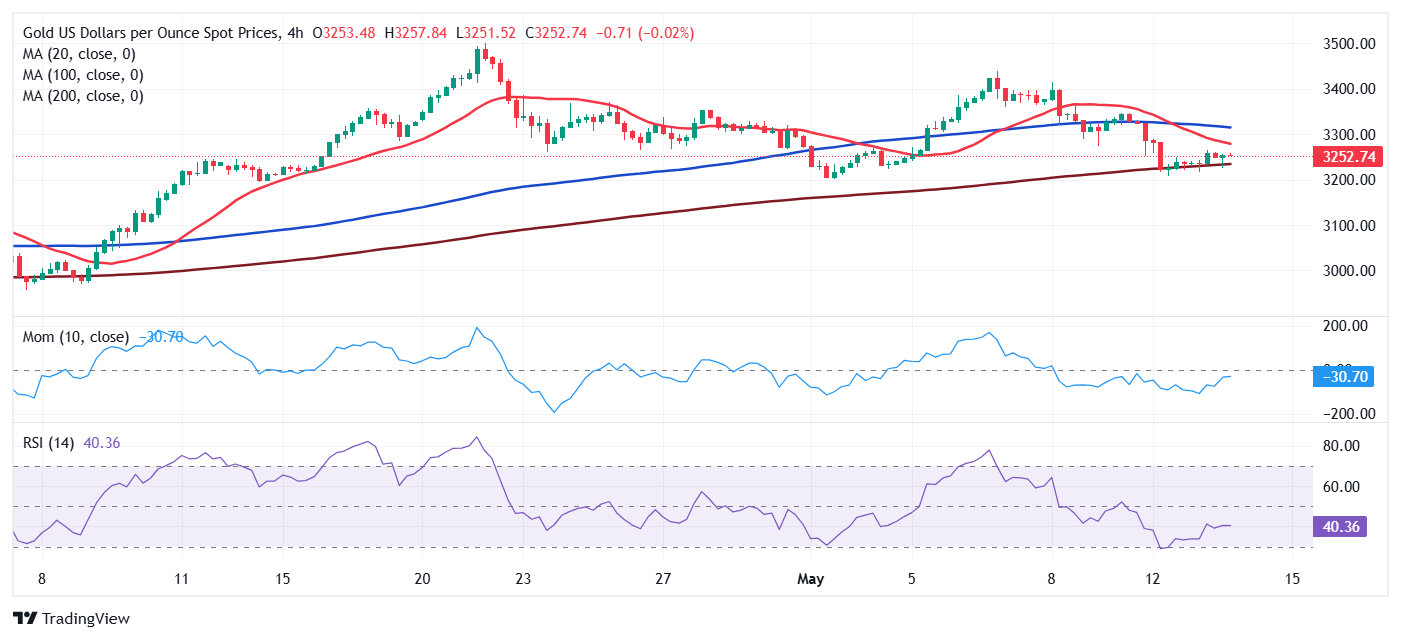
XAU/USD hovers around $3,250, and the daily chart shows a limited upward potential. The pair keeps developing below a flat 20 Simple Moving Average (SMA), providing dynamic resistance at around $3,316.70. The 100 and 200 SMAs maintain their upward slopes far below the current level, suggesting bulls have not yet given up. Finally, technical indicators stand in neutral territory, with the Relative Strength Index (RSI) indicator consolidating at around 50, failing to provide clear directional clues.
In the near term, and according to the 4-hour chart, a mildly bullish 200 SMA at around $3.225.40 provides support for a second consecutive day, yet at the same time, the 20 SMA accelerated south above the current level and after crossing below a flat 100 SMA, in line with increased selling interest. Technical indicators, in the meantime, consolidate within negative levels, also supporting a bearish extension, particularly if the pair finally breaks below the mentioned 200 SMA.
Support levels: 3,241.90 3,225.40 3,212.85
Resistance levels: 3,265.40 3,281.60 3,305.65
Premium
You have reached your limit of 3 free articles for this month.
Start your subscription and get access to all our original articles.
Author

Valeria Bednarik
FXStreet
Valeria Bednarik was born and lives in Buenos Aires, Argentina. Her passion for math and numbers pushed her into studying economics in her younger years.


