Gold Price Forecast: XAU/USD holding within familiar levels around $2,350

XAU/USD Current price: $2,346.70
- The US Dollar turned south after a dismal ISM Manufacturing PMI.
- Investors await for US employment-related data spread throughout the week.
- XAU/USD aims higher in the near term, but additional gains still unclear.
Spot Gold started the day on the back foot, shedding some ground amid a better market mood, as reflected by the positive tone of equities. Investors welcomed in-line with expectations United States (US) inflation-related data released last week, as the country reported that the Personal Consumption Expenditures (PCE) Price Index rose 2.7% YoY in April, matching March's increase and the market expectation, while the monthly advance was slightly lower than anticipated.
XAU/USD changed course mid-European morning, accelerating its recovery after the release of mixed US data. On the one hand, S&P Global upwardly revised the May Manufacturing PMI to 51.3 from a preliminary estimate of 50.9. On the other, the official ISM Manufacturing PMI in the same month posted at 48.7, contracting from the 49.2 posted in April and below the expected 49.6. As a result, the US Dollar fell against all its major rivals, shedding ground alongside Wall Street. At the time being, the three major indexes trade in the red.
Meanwhile, US government bond yields retreat. The 10-year Treasury note currently offers 4.41%, down from an intraday peak of 4.50%, while the 2-year note yields 4.82%, down 7 basis points (bps) for the day.
The US macroeconomic calendar will revolve around employment-related figures. The country will release the JOLTS Job Openings report on Tuesday and the ADP survey on private job creation on Wednesday. Then, the usual weekly unemployment data will precede the monthly Nonfarm Payroll (NFP) report scheduled for Friday.
XAU/USD short-term technical outlook
The daily chart for the XAU/USD pair shows that the bullish potential remains limited despite Gold trading in the green. The pair remains below a flat 20 Simple Moving Average (SMA), while the longer moving averages maintain their upward slopes well below the current level. In the meantime, technical indicators lack directional strength and are still confined to neutral levels.
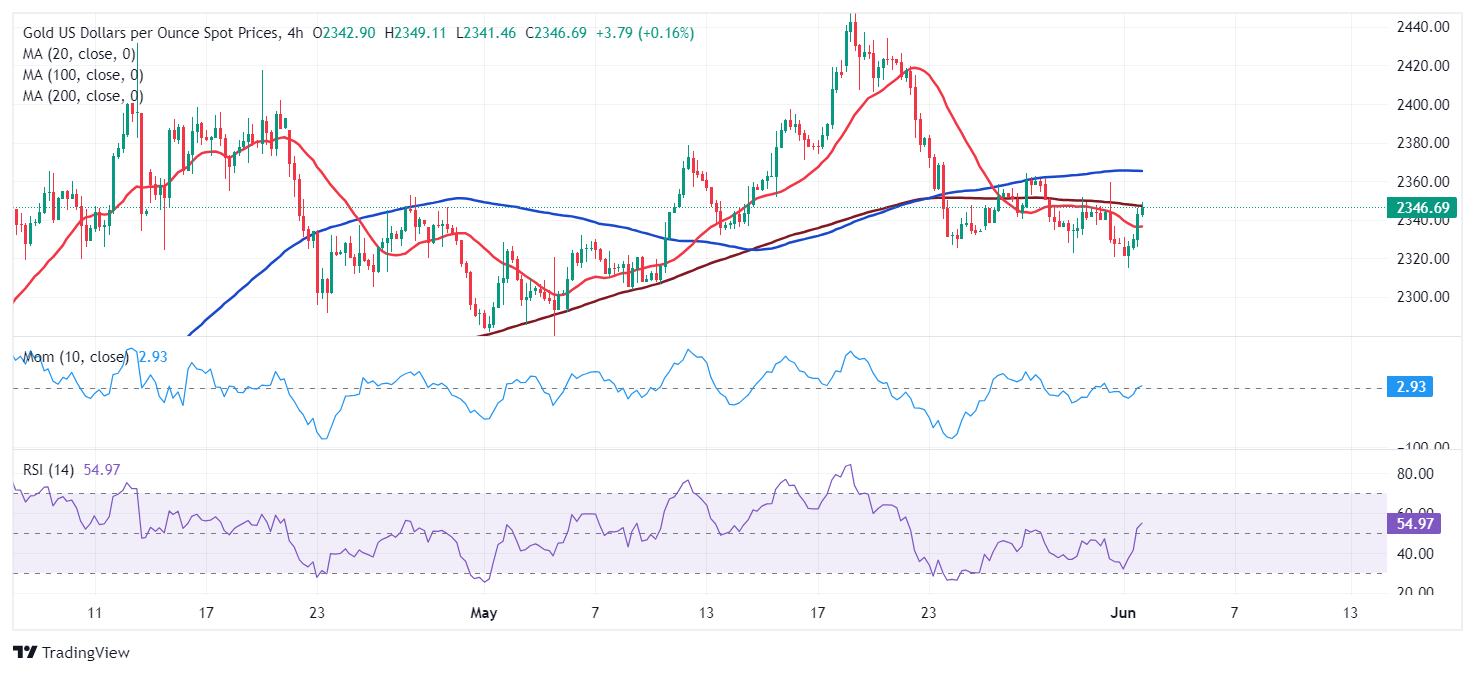
The 4-hour chart shows the bounce limited the near-term bearish potential, while additional gains do not seem likely. Technical indicators offer firmly bullish slopes but stand within neutral levels, barely overcoming their midlines. At the same time, XAU/USD is meeting sellers around a directionless 200 SMA, while the shorter moving averages also lack directional strength.
Support levels: 2,334.35 2,325.30 2,307.10
Resistance levels: 2,355.50 2,364.00 2,372.90
Author

Valeria Bednarik
FXStreet
Valeria Bednarik was born and lives in Buenos Aires, Argentina. Her passion for math and numbers pushed her into studying economics in her younger years.