Gold Price Forecast: XAU/USD eyes more pain stepping into the US inflation week
- Gold sellers extend control below $2,700 early Monday as the US holiday could exaggerate price moves.
- The US Dollar rally pauses despite firmer Treasury bond yields and China woes-driven tepid risk sentiment.
- Gold price looks to challenge critical $2,641 support as daily RSI pierces the midline from above.

Gold price has opened a new week on the back foot below $2,700, looking to extend its three-week losing streak. Rebounding US Treasury bond yields and China’s economic concerns offset a pause in the US Dollar( USD) upsurge, exerting additional downside pressure on Gold price.
Gold price kicks off the US inflation week on the back foot
US Treasury bond yields stage a comeback in Asian trading on Monday after a dovish US Federal Reserve (Fed) interest-rate cut decision-led retracement late last week.
Meanwhile, the market’s disappointment with China’s 10 trillion yuan ($1.4 trillion) debt package and softening inflation raised concerns over the dragon nation’s economic prospects, rendering negative for Gold price. China is the world’s biggest Gold consumer.
China’s CPI rose 0.3% last month from a year earlier, slowing from September's 0.4% rise and the lowest since June, data from the National Bureau of Statistics (NBS) showed on Saturday, missing a 0.4% increase estimated.
Further, investors remain wary of the more profound economic consequences of potential tariffs that US President-elect Donald Trump will impose once he returns to office in January of next year. This nervousness remains a drag on the bright metal even as USD buyers take a breather following the previous week’s relentless rise.
Gold traders also resort to position adjustments heading into the all-important US Consumer Price Index (CPI) inflation data due for release on Wednesday. However, a Veterans Day holiday in the US could exaggerate the Gold price action in the upcoming sessions.
Looking ahead, the broader market sentiment will play a pivotal role in influencing the value of the USD and the Gold price amid holiday-thinned trading conditions.
Gold price technical analysis: Daily chart
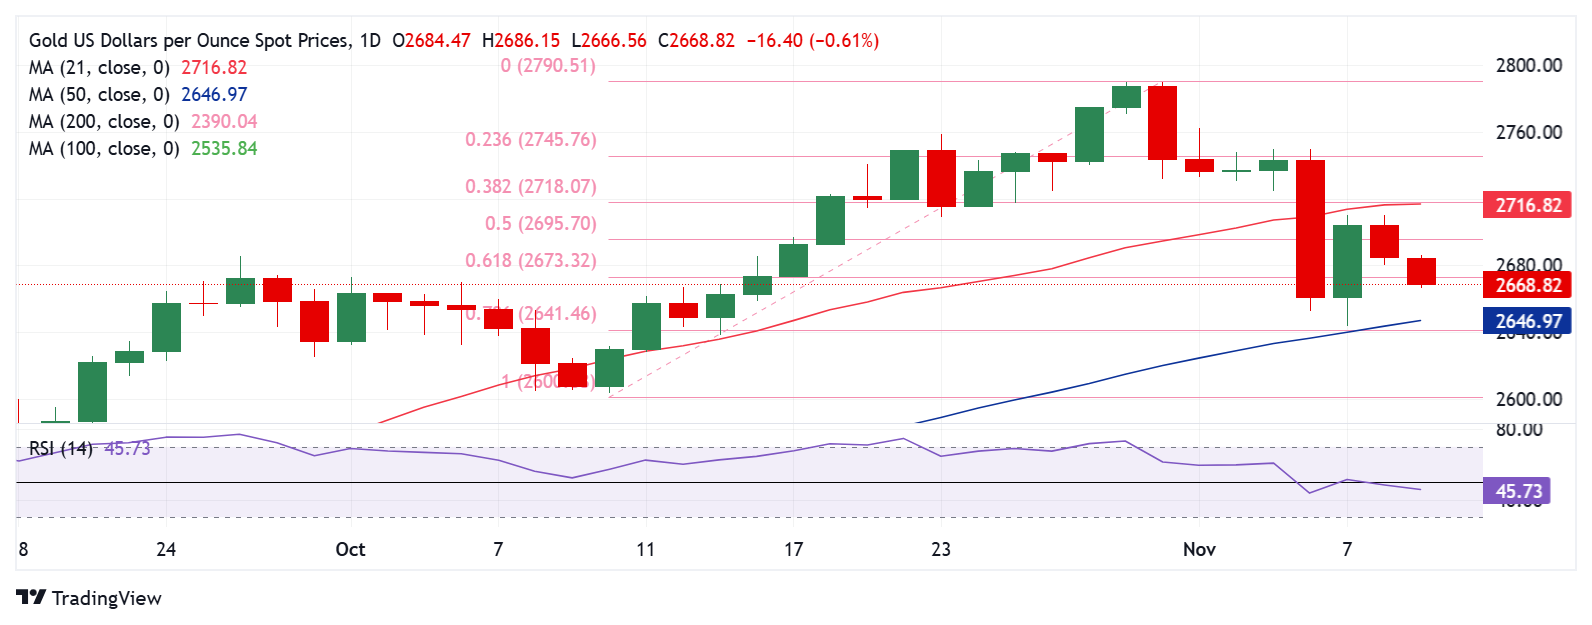
As observed on the daily chart, Gold price breached support at $2,673, the 61.8% Fibonacci Retracement (Fibo) level of the latest record rally from the October 10 low of $2,604 to the new all-time high of $2,790, as it witnessed a fresh leg down.
If the downside momentum gathers traction, sellers will attack $2,641 strong support again, which is the confluence of the 50-day Simple Moving Average (SMA) and the 78.6% Fibo level of the same advance.
The 14-day Relative Strength Index (RSI) points lower below the 50 level, having pierced that level from above on Friday. The leading indicator, therefore, suggests that more pain remains in the offing for Gold price.
On finding a solid foothold below the abovementioned critical support at $2,641, Gold sellers could flex their muscles toward the October 10 low of $2,604.
Conversely, Gold buyers need acceptance above the $2,700 barrier to test the healthy resistance at $2,718, where the 38.2% Fibo level and 21-day SMA converge.
A fresh uptrend would be initiated above that level as buyers aim for the previous static resistance near $2,745, where the 23.6% Fibo aligns.
Gold FAQs
Gold has played a key role in human’s history as it has been widely used as a store of value and medium of exchange. Currently, apart from its shine and usage for jewelry, the precious metal is widely seen as a safe-haven asset, meaning that it is considered a good investment during turbulent times. Gold is also widely seen as a hedge against inflation and against depreciating currencies as it doesn’t rely on any specific issuer or government.
Central banks are the biggest Gold holders. In their aim to support their currencies in turbulent times, central banks tend to diversify their reserves and buy Gold to improve the perceived strength of the economy and the currency. High Gold reserves can be a source of trust for a country’s solvency. Central banks added 1,136 tonnes of Gold worth around $70 billion to their reserves in 2022, according to data from the World Gold Council. This is the highest yearly purchase since records began. Central banks from emerging economies such as China, India and Turkey are quickly increasing their Gold reserves.
Gold has an inverse correlation with the US Dollar and US Treasuries, which are both major reserve and safe-haven assets. When the Dollar depreciates, Gold tends to rise, enabling investors and central banks to diversify their assets in turbulent times. Gold is also inversely correlated with risk assets. A rally in the stock market tends to weaken Gold price, while sell-offs in riskier markets tend to favor the precious metal.
The price can move due to a wide range of factors. Geopolitical instability or fears of a deep recession can quickly make Gold price escalate due to its safe-haven status. As a yield-less asset, Gold tends to rise with lower interest rates, while higher cost of money usually weighs down on the yellow metal. Still, most moves depend on how the US Dollar (USD) behaves as the asset is priced in dollars (XAU/USD). A strong Dollar tends to keep the price of Gold controlled, whereas a weaker Dollar is likely to push Gold prices up.
Author

Dhwani Mehta
FXStreet
Residing in Mumbai (India), Dhwani is a Senior Analyst and Manager of the Asian session at FXStreet. She has over 10 years of experience in analyzing and covering the global financial markets, with specialization in Forex and commodities markets.


