Gold Price Forecast: XAU/USD eyes a sustained move below $1800 amid bearish technicals


  • Gold price is testing the downside, with more losses in the offing.
  • US dollar holds firmer on the session amid return of risk-off mood.
  • Bears likely to remain in control, as the daily chart suggests.

Gold price once again witnessed good two-way businesses on Tuesday, initially rallying as high as $1825 before reversing sharply to settle around $1810. The 10-year US Treasury slid to the lowest levels in five-month lows on global economic growth concerns, in light of the rapid spread of the Delta covid variant. In early American trading, gold price saw a sharp downtick after facing rejection at the critical 200-Daily Moving Average (DMA) at $1825. The rebound in the US yields drove the greenback higher amid stimulus optimism while the risk sentiment improved on Wall Street after the world’s richest man, Jeff Bezos successfully completed a short trip to space. However, the retreat in the dollar amid risk-on flows helped gold price recover ground towards the closing.

Heading into the Senate Democrats’ vote on the US infrastructure package, the US dollar has caught a fresh bid wave while markets have turned nervous once again, as concerns over the Delta covid strain continue to lurk. Gold price, therefore, remains on the back foot towards $1800. Although the losses remain capped by a retreat in the US rates amid a cautious mood. Going ahead, gold price remains exposed to downside risks, as covid concerns and US-China tensions loom in the background, boding well for the safe-haven dollar. The broader market sentiment will be closely followed amid a data-scarce US docket and ahead of President Joe Biden’s infrastructure bill vote.

Gold Price Chart - Technical outlook
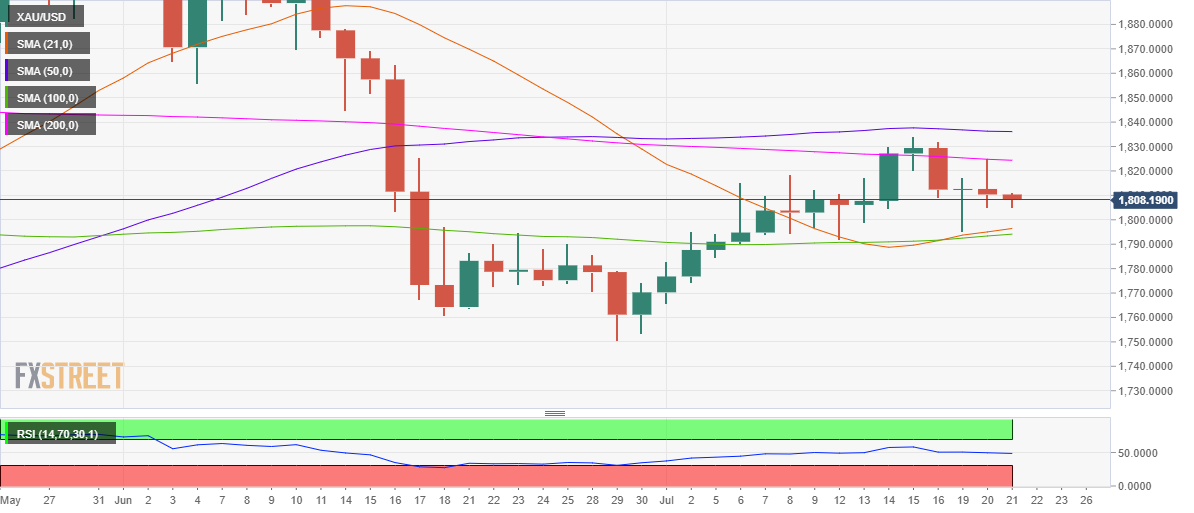
Gold: Daily chart

Technically, gold bears remain on track to test the $1800 mark following its rejection at the 200-DMA.

A sustained break below the latter could trigger a fresh decline towards the critical demand zone around $1795, where the 21-DMA and 100-DMA meet.

The 14-day Relative Strength Index (RSI) has pierced through the midline and entered the bearish zone, supporting the case for further downside.

The next relevant support awaits at the July 12 low of $1792.

On the flip side, the 200-DMA will be the level to beat for the bulls. Ahead of that the July 19 high of $1817 could be retested.


Information on these pages contains forward-looking statements that involve risks and uncertainties. Markets and instruments profiled on this page are for informational purposes only and should not in any way come across as a recommendation to buy or sell in these assets. You should do your own thorough research before making any investment decisions. FXStreet does not in any way guarantee that this information is free from mistakes, errors, or material misstatements. It also does not guarantee that this information is of a timely nature. Investing in Open Markets involves a great deal of risk, including the loss of all or a portion of your investment, as well as emotional distress. All risks, losses and costs associated with investing, including total loss of principal, are your responsibility. The views and opinions expressed in this article are those of the authors and do not necessarily reflect the official policy or position of FXStreet nor its advertisers. The author will not be held responsible for information that is found at the end of links posted on this page.

If not otherwise explicitly mentioned in the body of the article, at the time of writing, the author has no position in any stock mentioned in this article and no business relationship with any company mentioned. The author has not received compensation for writing this article, other than from FXStreet.

FXStreet and the author do not provide personalized recommendations. The author makes no representations as to the accuracy, completeness, or suitability of this information. FXStreet and the author will not be liable for any errors, omissions or any losses, injuries or damages arising from this information and its display or use. Errors and omissions excepted.

The author and FXStreet are not registered investment advisors and nothing in this article is intended to be investment advice.

Recommended Content


Recommended Content

Editors’ Picks

EUR/USD regains traction, recovers above 1.0700

EUR/USD regains traction, recovers above 1.0700

EUR/USD regained its traction and turned positive on the day above 1.0700 in the American session. The US Dollar struggles to preserve its strength after the data from the US showed that the economy grew at a softer pace than expected in Q1.

EUR/USD News

GBP/USD returns to 1.2500 area in volatile session

GBP/USD returns to 1.2500 area in volatile session

GBP/USD reversed its direction and recovered to 1.2500 after falling to the 1.2450 area earlier in the day. Although markets remain risk-averse, the US Dollar struggles to find demand following the disappointing GDP data.

GBP/USD News

Gold climbs above $2,340 following earlier drop

Gold climbs above $2,340 following earlier drop

Gold fell below $2,320 in the early American session as US yields shot higher after the data showed a significant increase in the US GDP price deflator in Q1. With safe-haven flows dominating the markets, however, XAU/USD reversed its direction and rose above $2,340.

Gold News

XRP extends its decline, crypto experts comment on Ripple stablecoin and benefits for XRP Ledger

XRP extends its decline, crypto experts comment on Ripple stablecoin and benefits for XRP Ledger

Ripple extends decline to $0.52 on Thursday, wipes out weekly gains. Crypto expert asks Ripple CTO how the stablecoin will benefit the XRP Ledger and native token XRP. 

Read more

After the US close, it’s the Tokyo CPI

After the US close, it’s the Tokyo CPI

After the US close, it’s the Tokyo CPI, a reliable indicator of the national number and then the BoJ policy announcement. Tokyo CPI ex food and energy in Japan was a rise to 2.90% in March from 2.50%.

Read more

Majors

Cryptocurrencies

Signatures