Gold Price Forecast: XAU/USD extends slide below $2,400

XAU/USD Current price: $2,392.80
- Wall Street recovers amid mounting speculation Donald Trump could win the US elections.
- United States first-tier data to be out later in the week keeps investors in cautious mode.
- XAU/USD remains under selling pressure in the near term, support at $2,377.10.
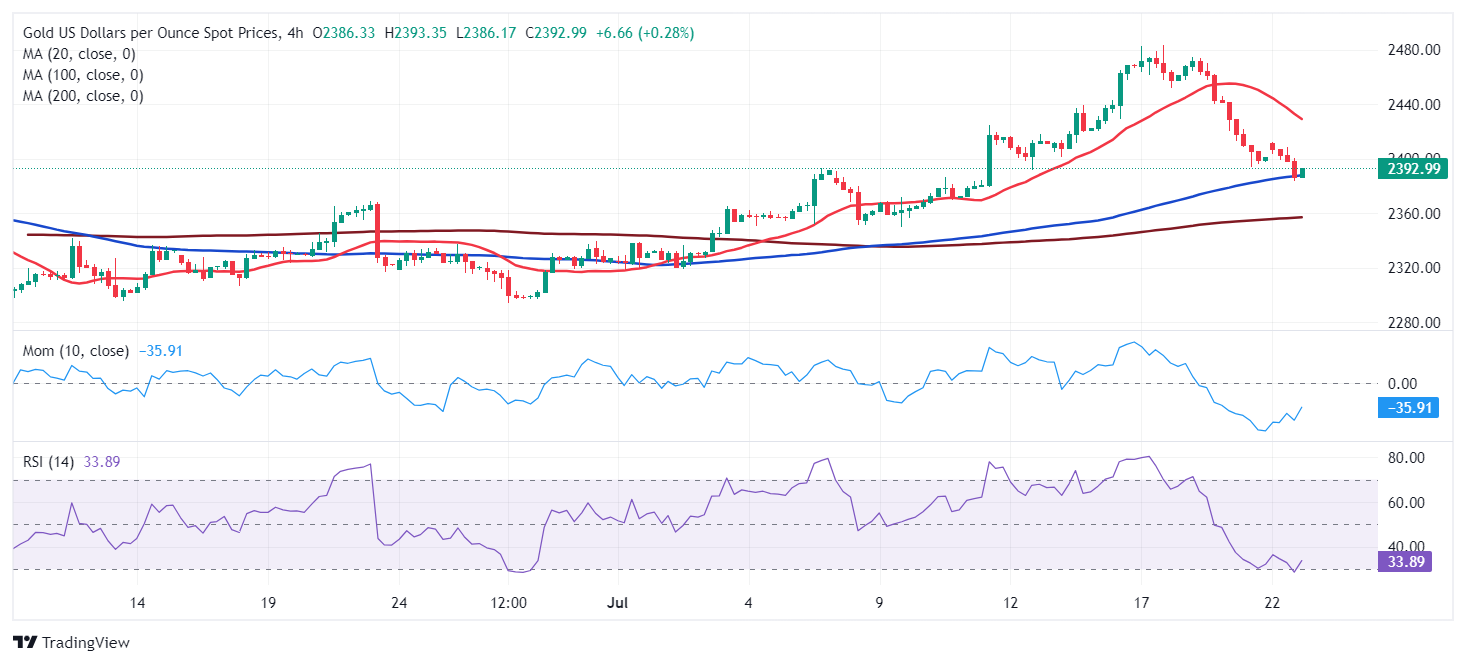
Spot Gold keeps marching south on Monday, with XAU/USD trading at around $2,390. The bright metal peaked last week at a record high of $2,483.63, retreating afterwards straight to the current levels. The US Dollar gained upward traction after Wall Street’s opening, while stocks recover following one of the worst weeks of the year.
Optimism seems to be benefiting the American currency despite political noise from the weekend. President Joe Biden decided to step down from the presidential race, which ended up boosting hopes for a Donald Trump victory, known for being more “pro-market.”
Meanwhile, upcoming United States (US) first-tier figures maintain investors in wait-and-see mode. The country will publish this week the first estimate of the Q2 Gross Domestic Product (GDP), alongside a revision of the Fed’s favorite inflation gauge for the first quarter, the Personal Consumption Expenditures (PCE) Price Index. Additionally, the US will release June PCE inflation on Friday.
XAU/USD short-term technical outlook
The XAU/USD pair is down for a fourth consecutive day, with the slide decelerating, suggesting the correction may soon be over. The daily chart shows the pair holds above a bullish 20 Simple Moving Average (SMA) which advances above also ascending 100 and 200 SMAs while providing dynamic support at around $2,377.10. Meanwhile, the technical indicators are losing their downward strength within positive levels, near completing the overbought correction.
In hte near term, and according to the 4-hour chart, the risk remains skewed to the downside. XAU/USD trades below a firmly bearish 20 SMA, while pressures a mildly bullish 100 SMA, suggesting continued selling pressure. At the same time technical indicators head south near oversold readings, with no signs of changing course.
Support levels: 2,377.10 2,364.00 2,349.50
Resistance levels: 2,412.10 2,425.70 2,439.90
Author

Valeria Bednarik
FXStreet
Valeria Bednarik was born and lives in Buenos Aires, Argentina. Her passion for math and numbers pushed her into studying economics in her younger years.