Gold Price Forecast: XAU/USD dips below $3,000 amid a trade war escalation

XAU/USD Current price: $2,972.83
- Global indexes plunged amid tit-for-tat retaliatory levies between Washington and Beijing.
- The US Dollar found temporary footing on risk aversion, gains limited by recession fears.
- XAU/USD pressures intraday lows and seems poised to extend its slide.
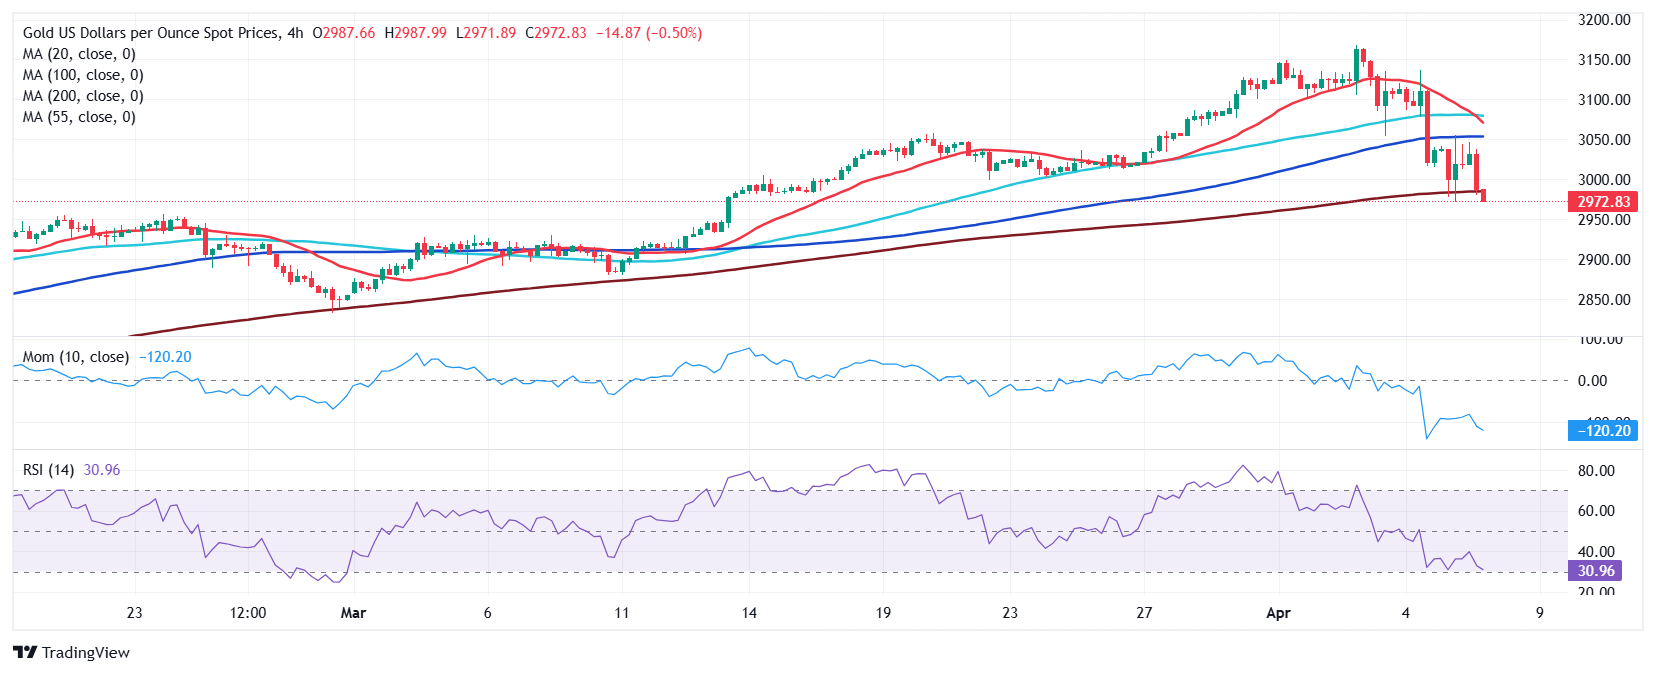
Spot Gold trades in the $2,970 region, approaching the intraday low posted during the Asian session at $2,971.28. Financial markets have been on their toes ever since the day started amid the escalation of the trade war unleashed by United States (US) President Donald Trump last week.
Despite comments about being willing to negotiate retaliatory tariffs announced last Wednesday, Trump decided to lift the bet and pledged additional 50% tariffs on China if Beijing does not back off on the 34% retaliatory levies announced over the weekend.
Chinese announcement sent Asian indexes into a selling spiral, which continued during European trading hours. All indexes closed in the red and with sharp losses, while Wall Street futures also fell. By the time being, indexes managed to bounce from their intraday lows, but are consolidating losses.
In the meantime, rumors of a potential 90-day delay on the implementation of reciprocal tariffs lifted the mood early in the American session, yet hopes were short-lived, as the White House quickly denied such a possibility. Trump, however, repeated on Truth Social that negotiations with “other countries” will take place “immediately.”
Tariff-related developments will dominate the scene during the upcoming days, alongside the trend of all assets. At the time being, the US Dollar (USD) finds risk-related demand, but that may change, considering the ultimate fear is that tariffs will result in higher inflation alongside an economic recession. Markets foresee a gloomy future for the USA, which will impact all other major economies.
XAU/USD short-term technical outlook
From a technical point of view, XAU/USD is poised to extend its slide. The daily chart shows that the pair is developing below its 20 Simple Moving Average (SMA), which now acts as dynamic resistance at around $3,033.60. The 100 and 200 SMAs keep heading north far below the current level, yet technical indicators head south vertically and within negative levels, anticipating another leg south.
In the near term, and according to the 4-hour chart, the bearish case is even clearer. The 20 SMA turned sharply lower, still holding above the 100 and 200 SMAs, which, anyway, lost their bullish strength. The XAU/USD pair is currently piercing its 200 SMA a handful of $ above the current level, while technical indicators resumed their slides after barely correcting early oversold conditions. Immediate support comes at around 2,959.00, where the pair topped late in February. A clear break lower opens the door for a steeper Gold slide.
Support levels: 2,959.00 2,942.50 2,929.45
Resistance levels: 2,982.20 2,998.30 3,015.55
US-China Trade War FAQs
Generally speaking, a trade war is an economic conflict between two or more countries due to extreme protectionism on one end. It implies the creation of trade barriers, such as tariffs, which result in counter-barriers, escalating import costs, and hence the cost of living.
An economic conflict between the United States (US) and China began early in 2018, when President Donald Trump set trade barriers on China, claiming unfair commercial practices and intellectual property theft from the Asian giant. China took retaliatory action, imposing tariffs on multiple US goods, such as automobiles and soybeans. Tensions escalated until the two countries signed the US-China Phase One trade deal in January 2020. The agreement required structural reforms and other changes to China’s economic and trade regime and pretended to restore stability and trust between the two nations. However, the Coronavirus pandemic took the focus out of the conflict. Yet, it is worth mentioning that President Joe Biden, who took office after Trump, kept tariffs in place and even added some additional levies.
The return of Donald Trump to the White House as the 47th US President has sparked a fresh wave of tensions between the two countries. During the 2024 election campaign, Trump pledged to impose 60% tariffs on China once he returned to office, which he did on January 20, 2025. With Trump back, the US-China trade war is meant to resume where it was left, with tit-for-tat policies affecting the global economic landscape amid disruptions in global supply chains, resulting in a reduction in spending, particularly investment, and directly feeding into the Consumer Price Index inflation.
Author

Valeria Bednarik
FXStreet
Valeria Bednarik was born and lives in Buenos Aires, Argentina. Her passion for math and numbers pushed her into studying economics in her younger years.
















