Gold Price Forecast: XAU/USD confined within two key averages, awaits US CPI for fresh direction
- Gold price bounces off 21-Daily Moving Average, but 50 DMA offers stiff resistance.
- US Dollar recovers amid souring sentiment and buoyant US Treasury bond yields.
- Gold price awaits US Consumer Price Index data for a fresh directional move.

Gold price is treading water while defending the critical 200-Daily Moving Average (DMA) at $1,920 during early Tuesday dealings. Gold price is losing the upside traction as the United States Dollar (USD) finds its feet amid a negative shift in risk sentiment and the buoyant tone seen around the US Treasury bond yields.
Focus shifts to US Consumer Price Index data for a clear direction
Despite a positive close on Wall Street overnight, thanks to the tech stocks rally, Asian markets have turned cautious and remain a mixed bag as investors weigh the recent policy guidance from the Chinese and Japanese central banks.
Traders also refrain from placing fresh bets ahead of the all-important Consumer Price Index (CPI) data from the United States due on Wednesday, which will significantly influence the US Federal Reserve’s (Fed) interest rate outlook, helping shape broader market sentiment before next week’s Fed policy announcements.
Amidst a sense of caution, the US Dollar is finding its feet, regaining ground after falling the most in two months on profit-taking. Gold price is, therefore, struggling to extend its break above the bullish 200 DMA barrier, as the upside consolidation in the US Treasury bond yields also remains a drag on the non-interest-bearing Gold price.
The US Treasury bond yields continue to draw support from the optimism surrounding a likely ‘soft landing’ for the US economy. Looking ahead, the US inflation data will hold the key for a fresh directional move in Gold price, as the data would indicate whether the Federal Reserve has further to go in raising rates.
In the meantime, the Fed sentiment and risk trends will keep the US Dollar traders entertained, eventually impacting the Gold price action.
Gold price technical analysis: Daily chart
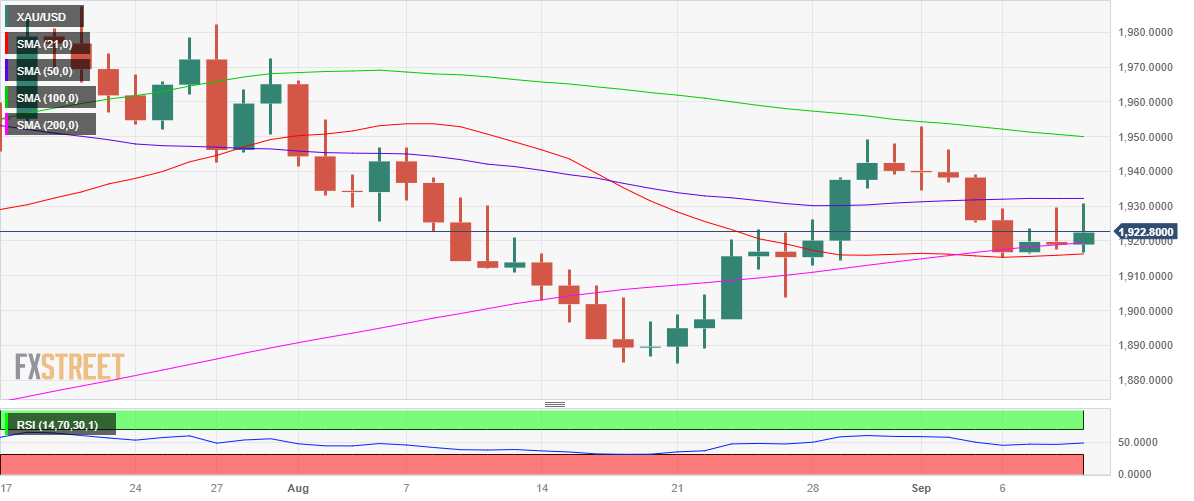
From a short-term technical perspective, nothing seems to have changed for the Gold price, as it is likely to extend its range trade between the horizontal 21- and 50-Daily Moving Averages (DMA) at $1,917 and $1,932 respectively, heading toward the US CPI release.
The 14-day Relative Strength Index (RSI) trades listlessly beneath the midline, keeping Gold sellers hopeful.
Gold sellers, however, need a daily closing below the 21 DMA support at $1,917 to confirm a range breakdown and revive the corrective downside toward the $1,900 threshold.
The following relevant cushion is $1,885, a line in the sand for Gold buyers.
Conversely, the immediate resistance is seen at the 50 DMA of $1,932, above which the 100 DMA hurdle at $1,949 will challenge bearish commitments.
The static resistance of $1,970 and the July 27 high of $1,982 will be next on the radar for Gold buyers.
Author

Dhwani Mehta
FXStreet
Residing in Mumbai (India), Dhwani is a Senior Analyst and Manager of the Asian session at FXStreet. She has over 10 years of experience in analyzing and covering the global financial markets, with specialization in Forex and commodities markets.


