Gold Price Forecast: XAU/USD choppy trading to continue below $1,825 amid thin markets
- Gold price remains stuck in a narrow range between $1,795 and $1,825.
- Concerns over China’s covid surge and its spread globally rattle risk sentiment.
- Mid-tier United States jobs data to have little impact on the US Dollar.
- Gold price could extend choppy trading within a triangle amid thin liquidity.

Gold price is extending the previous rebound above the $1,800 mark amid thin market conditions heading into the long New Year weekend. China’s surge in COVID-19 infections is spooking investors but the US Dollar is unable to capitalize on safe-haven flows, allowing the bright metal to recover some ground. The risk-aversion-induced flows into the US bond markets are weighing down on the Treasury bond yields, in turn, acting as a drag on the greenback. Weaker Treasury bond yields also make the non-yield Gold price attractive to investors. After China announced on Monday that it would end quarantine requirements for inbound travelers on January 8, several countries, including the US, the UK and Japan, have announced restrictions on arrivals from China. As China reopens its economy, it battles covid flare-ups, with its health system under severe stress.
The Asian stocks are in the red, tracking the weakness in Wall Street indices overnight while the US S&P 500 futures trade modestly flat, reflective of the damp market mood. The US Dollar index is losing 0.10% on the day, consolidating the previous recovery below 104.50, at the time of writing. Gold price is up 0.20% so far, trading at around $1,808.
On Wednesday, the US Pending Home Sales plunged another 37.8% in November, disappointing the market expectations of -36.7%. The US Dollar dropped to a multi-day trough on the weak US housing data but quickly staged a sharp recovery, as Wall Street indices extended their downtrend amid rising inflation and covid concerns.
Looking ahead, Gold traders will await the US weekly Jobless Claims data release in an otherwise quiet calendar. Risk trends and the US Dollar price action will be closely followed by Gold price, with volatility likely to remain high amid holiday-thinned market conditions.
Gold price technical analysis: Daily chart
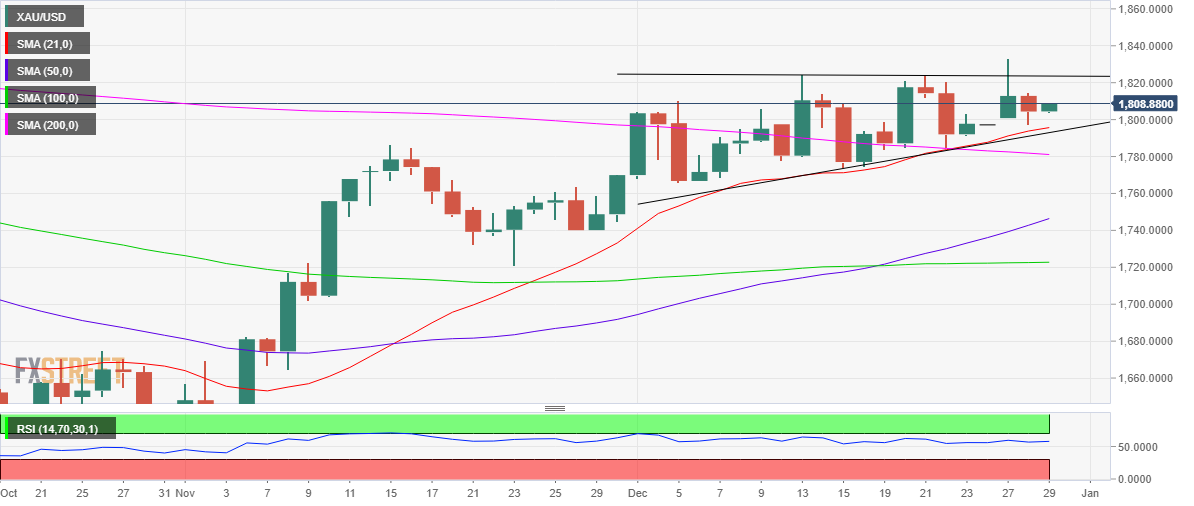
The short-term technical outlook for Gold price remains more or less the same, as the yellow metal continues to wave within an ascending triangle formation.
Only a daily close above the horizontal trendline (triangle) resistance will confirm the ascending triangle breakout. The next upside target on buyers’ radars will be the multi-month high at $1,833. Further up, the psychological $1,850 level will come into the picture.
The bullish 14-day Relative Strength Index (RSI) and a bull cross confirmation continue to back the bullish potential.
On the downside, Gold price could revisit Tuesday’s low at $1,800. The next critical support awaits at $1,795, which is the confluence of the rising trendline (triangle support line) and the bullish 21-Daily Moving Average (DMA). A downside break from the triangle could be seen on a daily closing below the latter, which could leave bulls in disarray.
Premium
You have reached your limit of 3 free articles for this month.
Start your subscription and get access to all our original articles.
Author

Dhwani Mehta
FXStreet
Residing in Mumbai (India), Dhwani is a Senior Analyst and Manager of the Asian session at FXStreet. She has over 10 years of experience in analyzing and covering the global financial markets, with specialization in Forex and commodities markets.


