Gold Price Forecast: XAU/USD bounced back, comfortable above $3,300

XAU/USD Current price: $3,331.01
- Back and forth between the United States and China spurs caution.
- Wall Street struggles to retain its positive momentum from last week.
- XAU/USD trimmed early losses, but additional gains unlikely in the near term.
Gold price changed course in the American session on Monday, and trades around $3,330, recovering nicely from an intraday low of $3,268.03. In the absence of relevant macroeconomic data, investors kept focusing on trade developments. Mixed headlines on United States-China trade talks spurred some concerns after a quiet start to the day, as cautious optimism led the Asian and European sessions, weighing on US Dollar (USD) demand.
The White House hinted at trade talks with its Asian counterpart last week, but Beijing stated on Monday that President Xi Jinping has not spoken with his United States (US) counterpart, Donald Trump. Meanwhile, Trump said that there are no red lines that would make him ease tariffs. “It always affects you a little bit,” Trump noted when asked about the potential impact on the USD, stocks, or even economic progress.
At the time being, Wall Street struggles to retain the green, with the Dow Jones Industrial Average (DJIA) being the best performer and the Nasdaq Composite being the worst.
Other than that, investors await first-tier data from major economies scheduled for later this week. Most figures will be released on Wednesday, with growth updates from Germany, the Eurozone (EU), the US and Canada. Meanwhile, Australia, Germany and the EU will post inflation updates. The cherry on the top will be US employment-related data, including different reports ahead of the Nonfarm Payrolls report scheduled for Friday.
XAU/USD short-term technical outlook
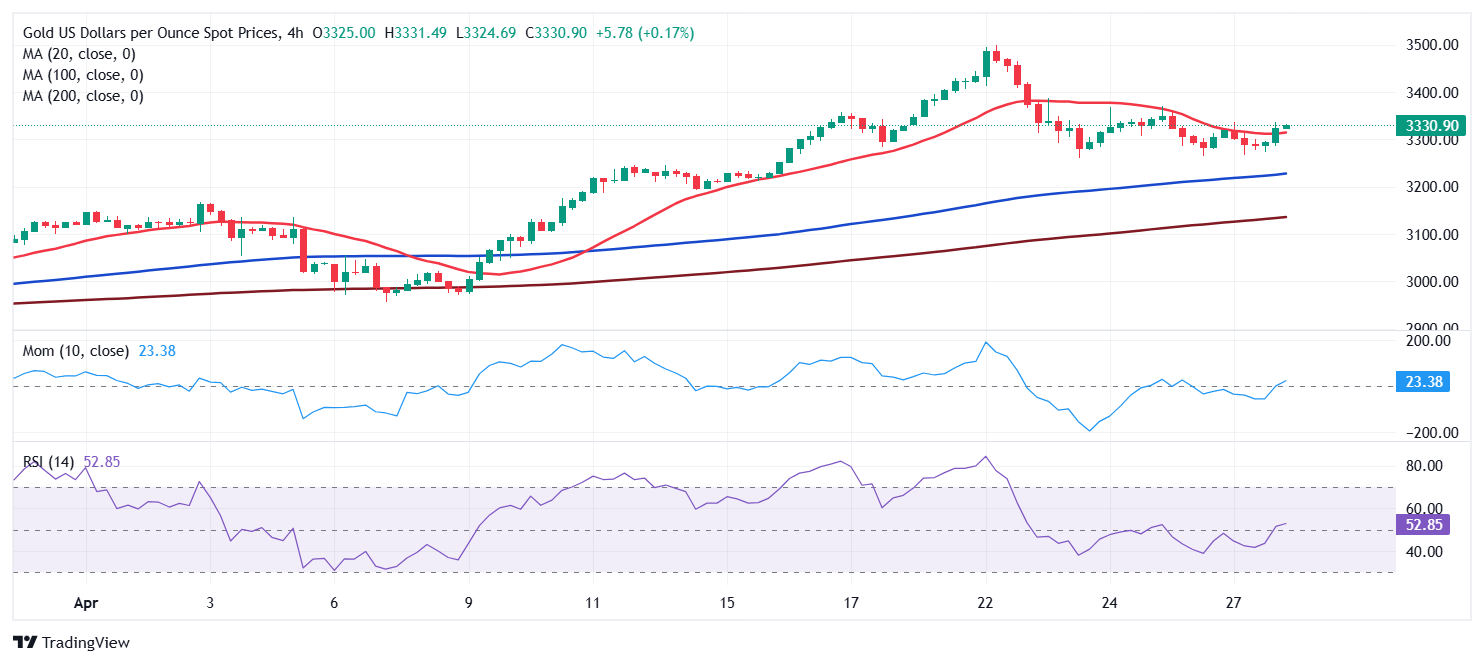
The XAU/USD pair trimmed early losses, but so far, it’s unable to recover its bullish stance. The daily chart for the pair shows it is hovering around its opening, while the risk remains skewed to the upside, given that it keeps developing above all bullish moving averages. The same chart shows a strong floor in the $3,260 region, as buyers surged around it in the last four trading days. Finally, technical indicators stand well above their midlines, albeit only the Momentum indicator aims north. The Relative Strength Index (RSI) indicator consolidates around 62, as XAU/USD can not extend gains beyond its recent range’s top in the $3,370/80 region.
The near-term picture is neutral-to-bullish. The 4-hour chart shows XAU/USD is currently battling to overcome a directionless 20 Simple Moving Average (SMA), while the 100 and 200 SMAs keep heading higher, over $100 below the current level. Technical indicators, in the meantime, advance, yet within negative levels and with limited upward strength.
Support levels: 3,314.50 3,301.40 3,288.70
Resistance levels: 3,344.60 3,358.10 3,370.00
Premium
You have reached your limit of 3 free articles for this month.
Start your subscription and get access to all our original articles.
Author

Valeria Bednarik
FXStreet
Valeria Bednarik was born and lives in Buenos Aires, Argentina. Her passion for math and numbers pushed her into studying economics in her younger years.


