Gold, the Chart of the Week: XAU/USD bears eye a run to key support near $1,675, US CPI eyed
- Gold is back under pressure as the bulls keep buying up the US dollar.
- The NFP data will keep the Fed on the back foot in the battle against inflation.
- Gold could be destined for a significant drop in the coming days in US CPI.

The gold price drifted lower into the close on Friday due to some of the bad news for the Federal Reserve that was revealed in the Nonfarm Payrolls report for the month of September with the Unemployment Rate, moving down to historically-low levels.
This goes against their battle to restore demand-supply-side balance in the labour market in the face of inflation, meaning that strong rate hikes are a given for the foreseeable future and this is a headwind for gold prices vs. a flattening curve. This will make for another critical week for the days ahead with plenty of US calendar events, including the minutes f the prior Fed meeting, US inflation data and Retail Sales.
We will open in Asia with the US dollar some 55 pips, or 0.5% higher than last week, as measured by the DXY index. The gold price starts out down 1% on Friday's business and 2% up on last week's open, leaving scope for a continued bearish correction in a strong US dollar environment as the following analysis illustrates:
Gold daily charts
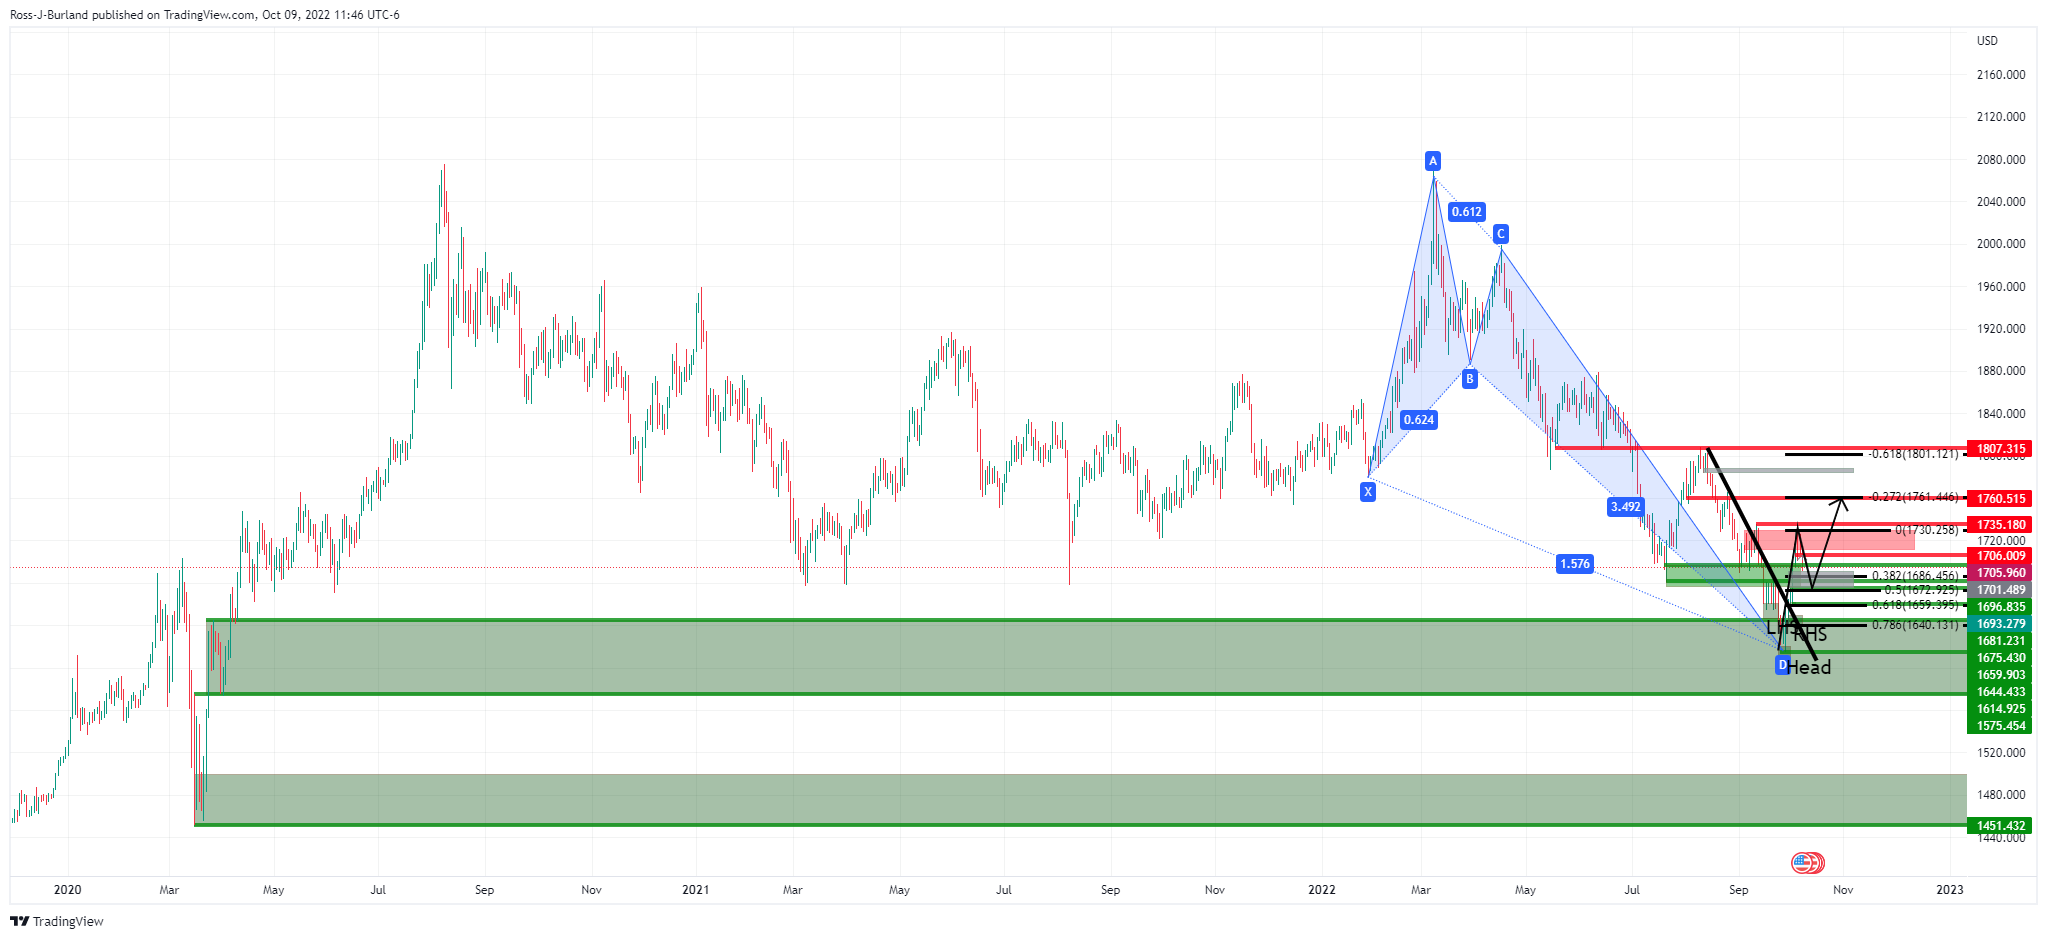
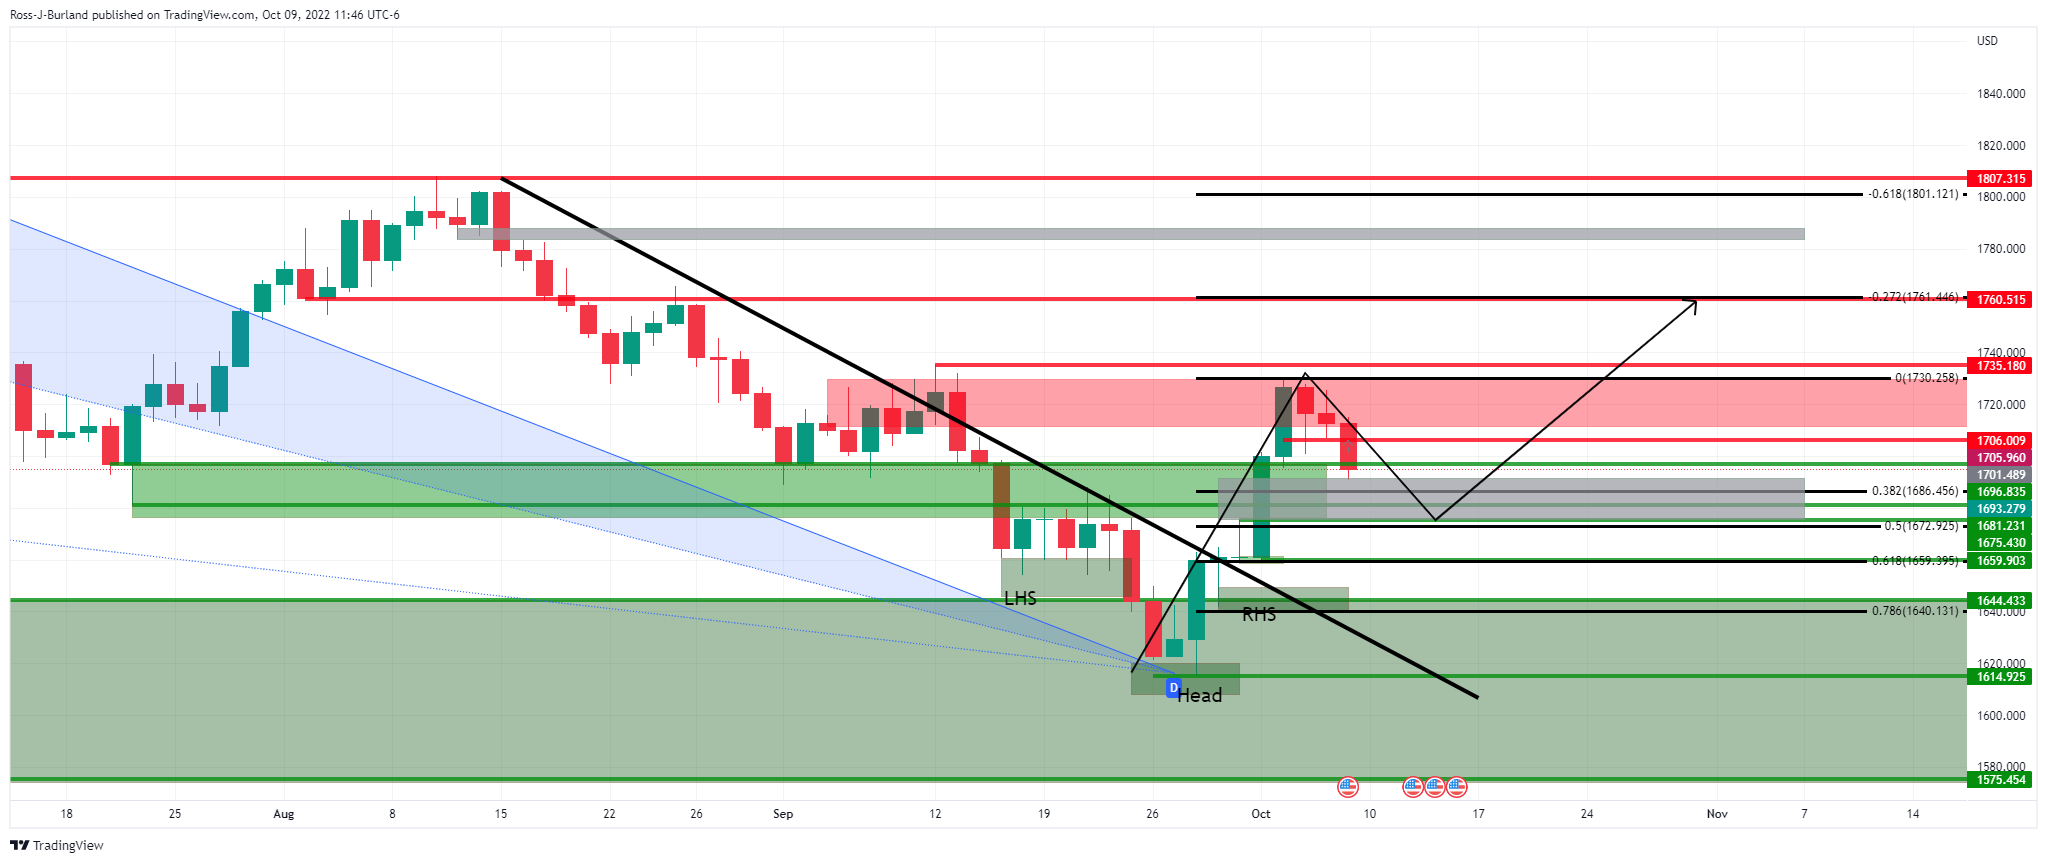
The following are of the same daily chart but zoomed in:
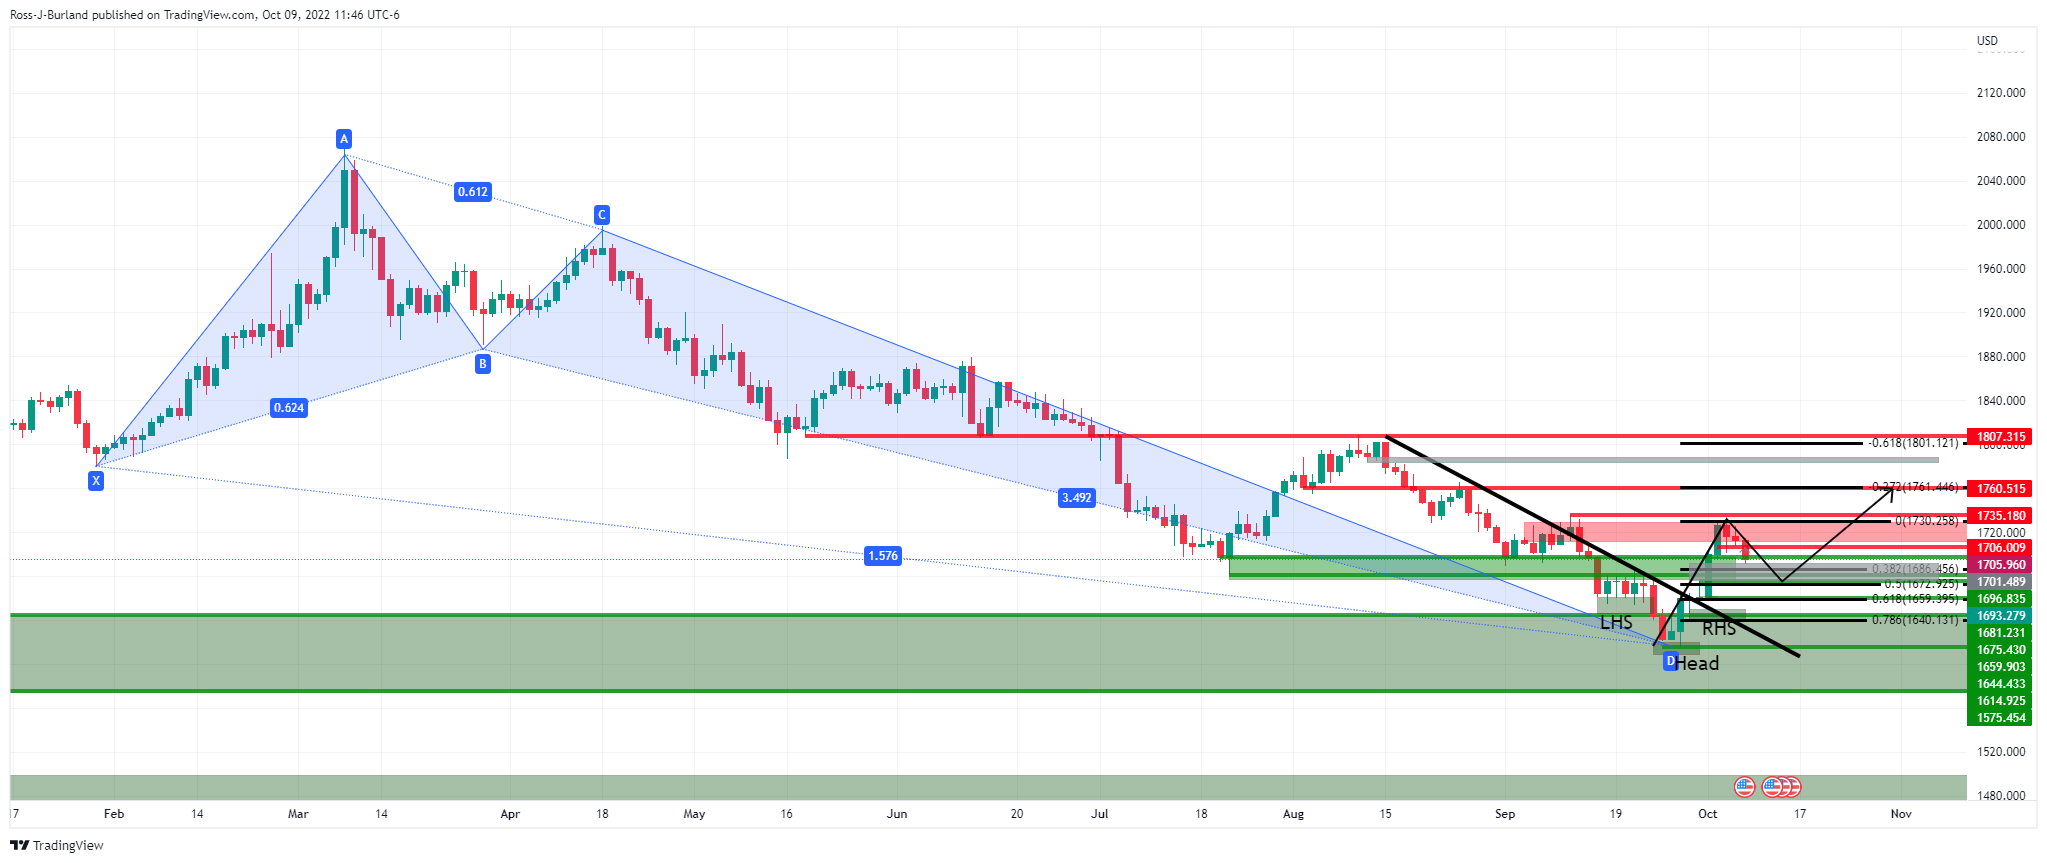
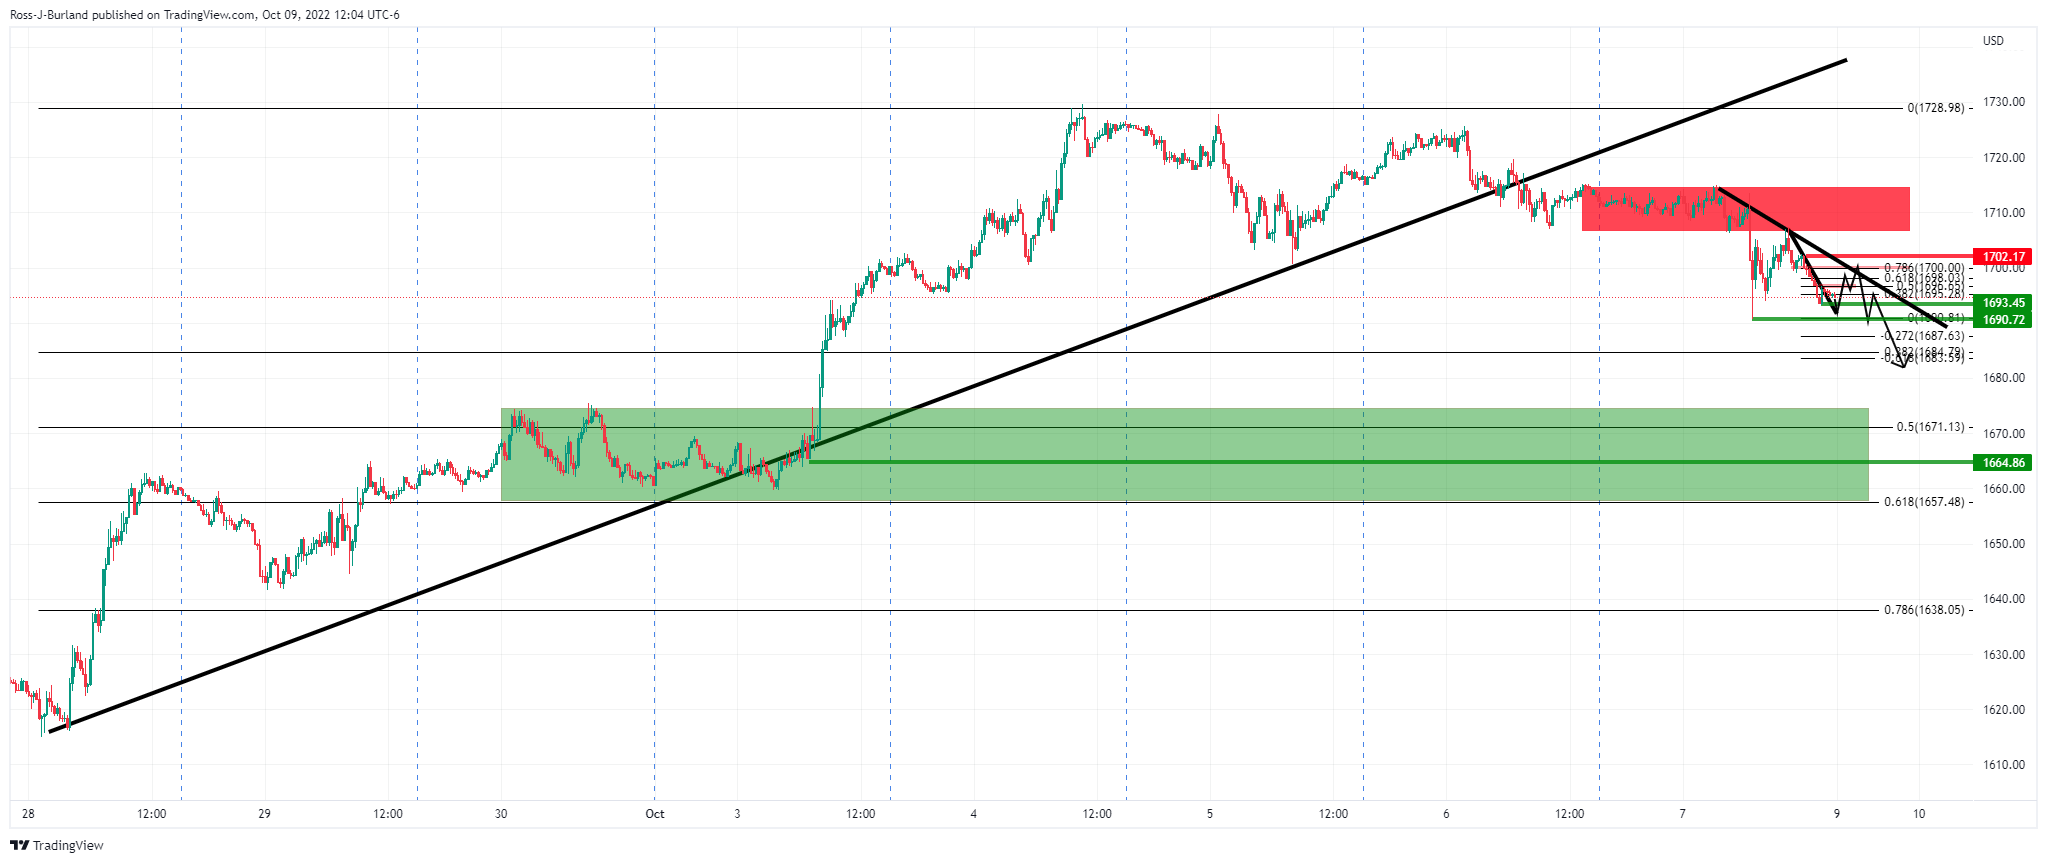
As illustrated in the above charts, the price is correcting the dominant bearish trend and has slid outside of the prior, late August, dynamic trendline resistance. The harmonic crab pattern is bullish while the price remains in corrective territories above the recent lows of $1,614 and $1,659 daily lows.
However, as the last illustration in the series of daily charts above shows, the price is meeting resistance around $1,730 and is in the process of correcting towards an area of price imbalance between Friday's lows of $1,690 and $1,675, the latter which is close to a 50% mean reversion of the daily bullish impulse. This is a critical area of interest for the week ahead that guards a move towards the restest of the dominant counter trendline and the aforementioned recent daily lows.
Gold H1 chart
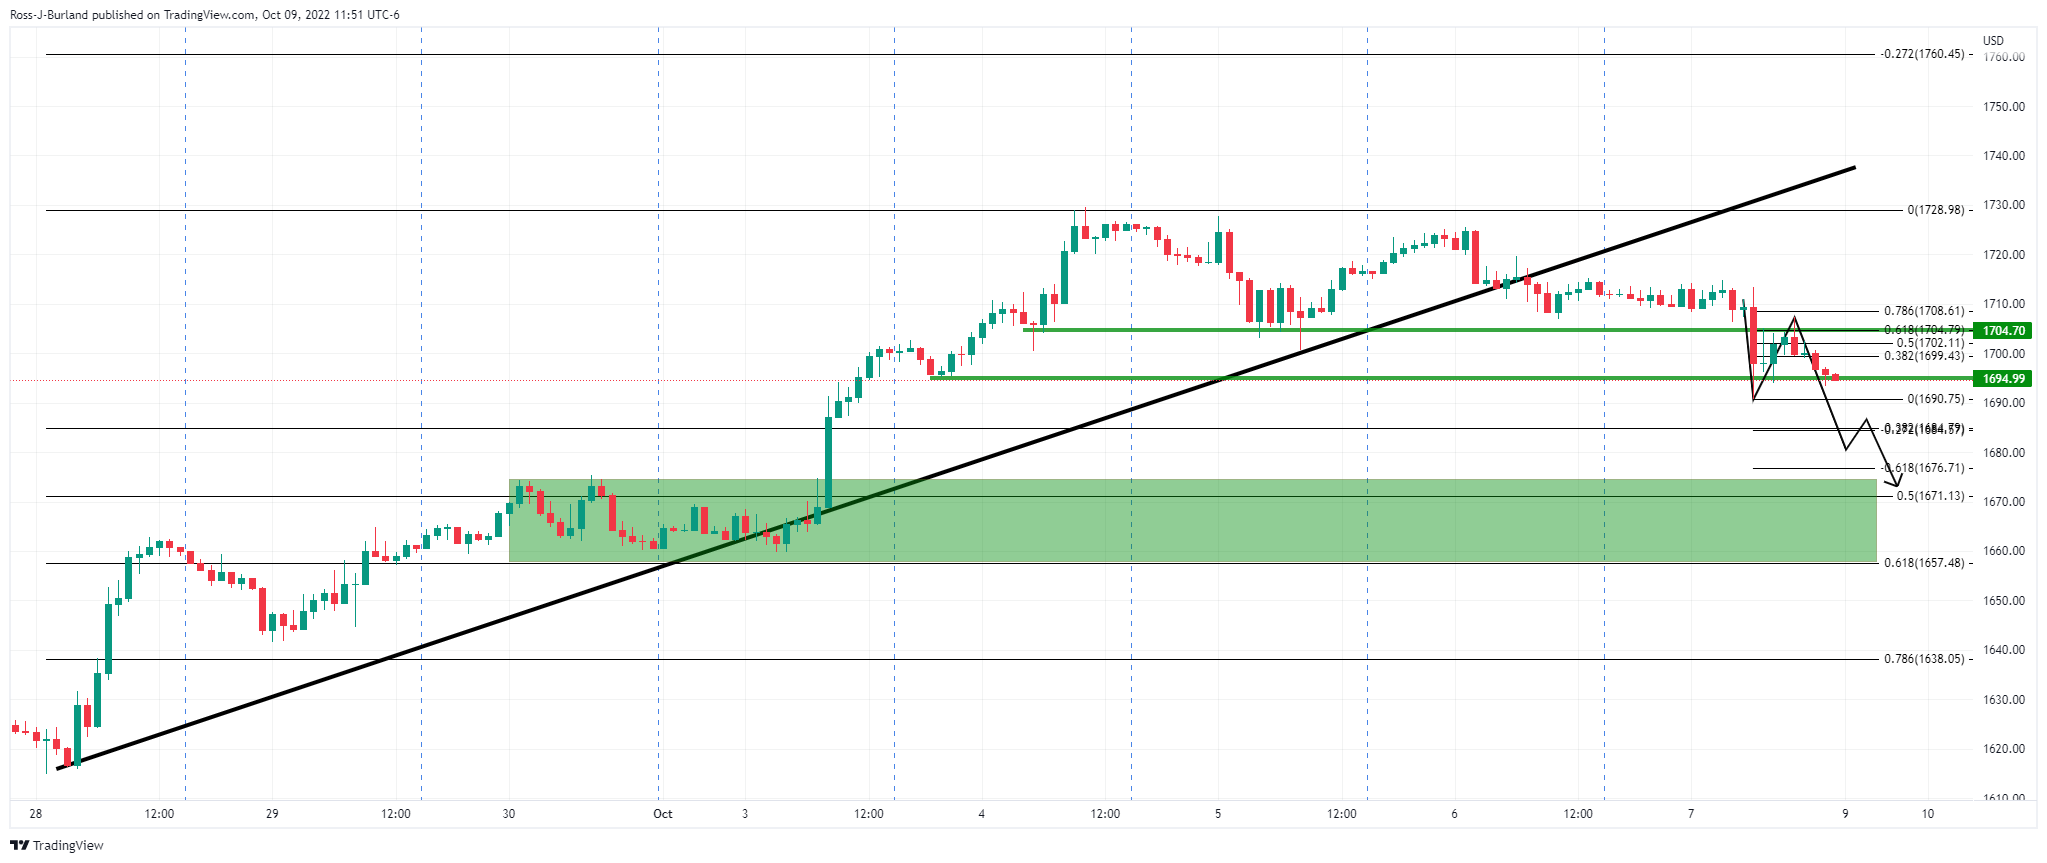
The hourly chart shows that the price is well on its way towards the said price imbalance as it starts to move out of the area of consolidation and support below the counter-trendline, as shown in the chart above. If the US dollar bulls move in at the start of the week, then there could be a quick move into mitigating the price imbalance resulting in a move-in on last week's high of $1,675 and the support thereabout to $1,659 daily lows.
Gold M15 charts
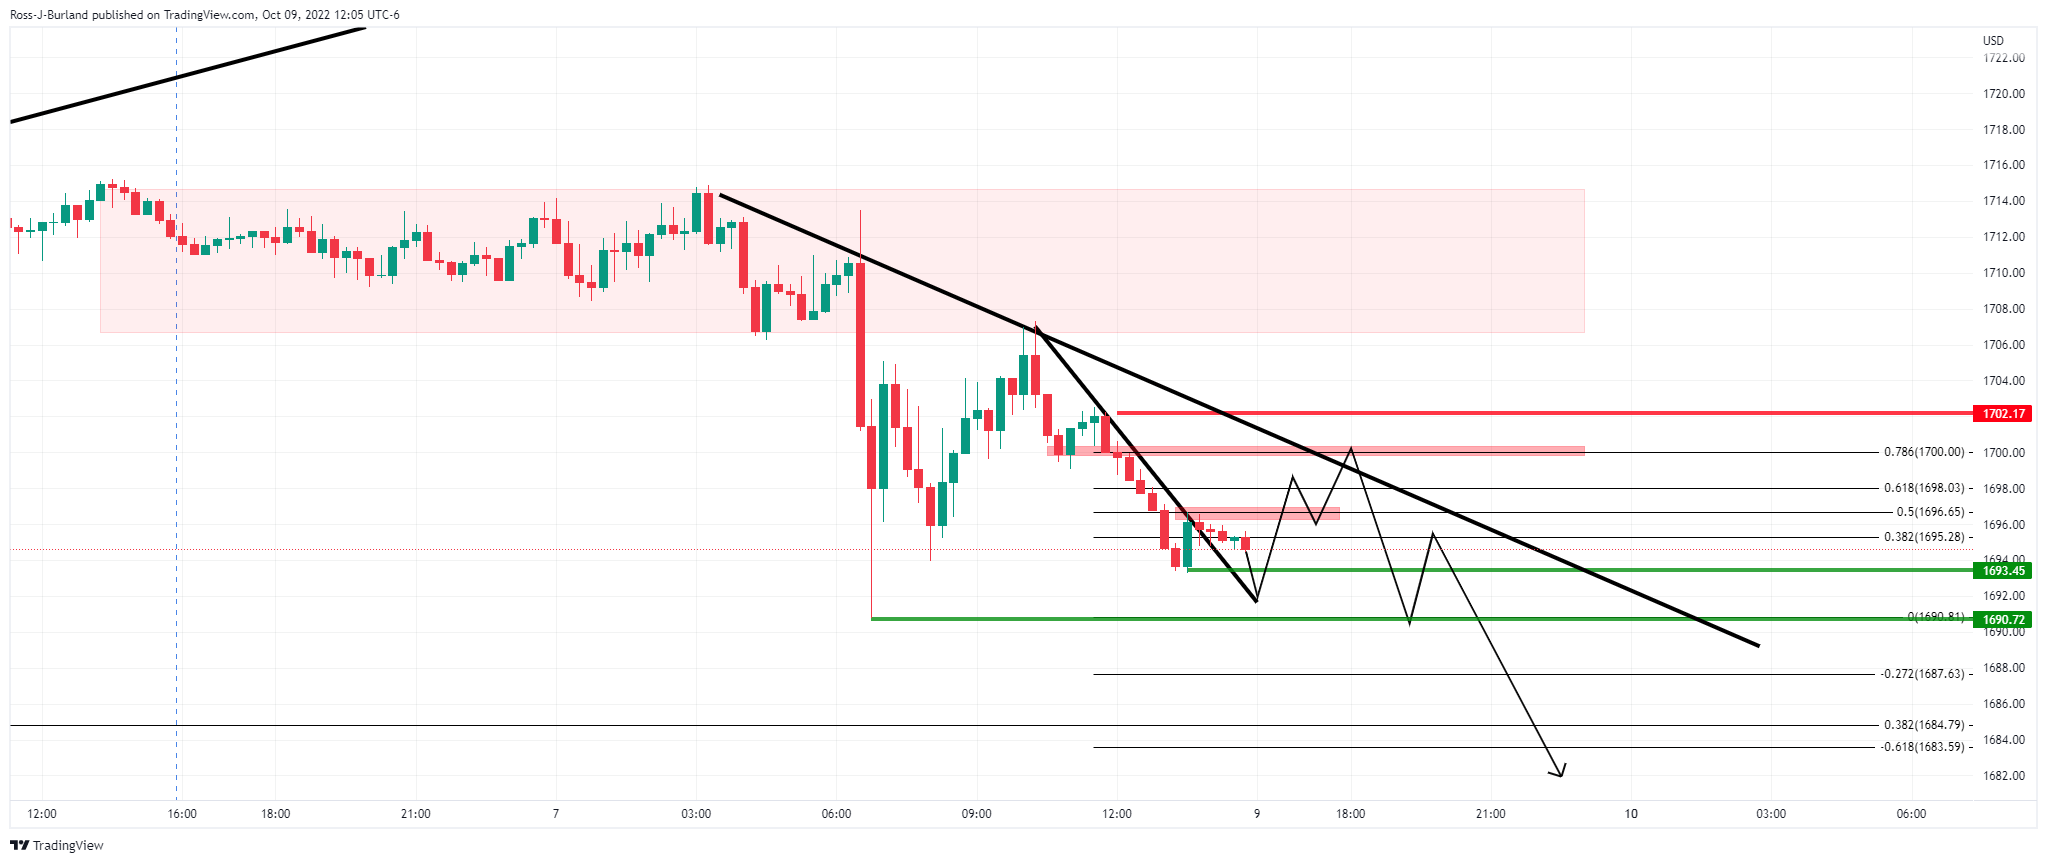
Zooming down to other 15-min charts, we have a potential meanwhile bullish scenario with the price moving beyond a meanwhile trendline resistance, although the dominant hourly trendline would be expected to cap bullish attempts below or slightly through $1,700 in the opening sessions of the week.
US dollar H4 chart
The US dollar broke above last week's lows of around 112.75 which is a bullish feature for the week ahead that leaves 114.00 on the radar as long as 111.95/55 holds:
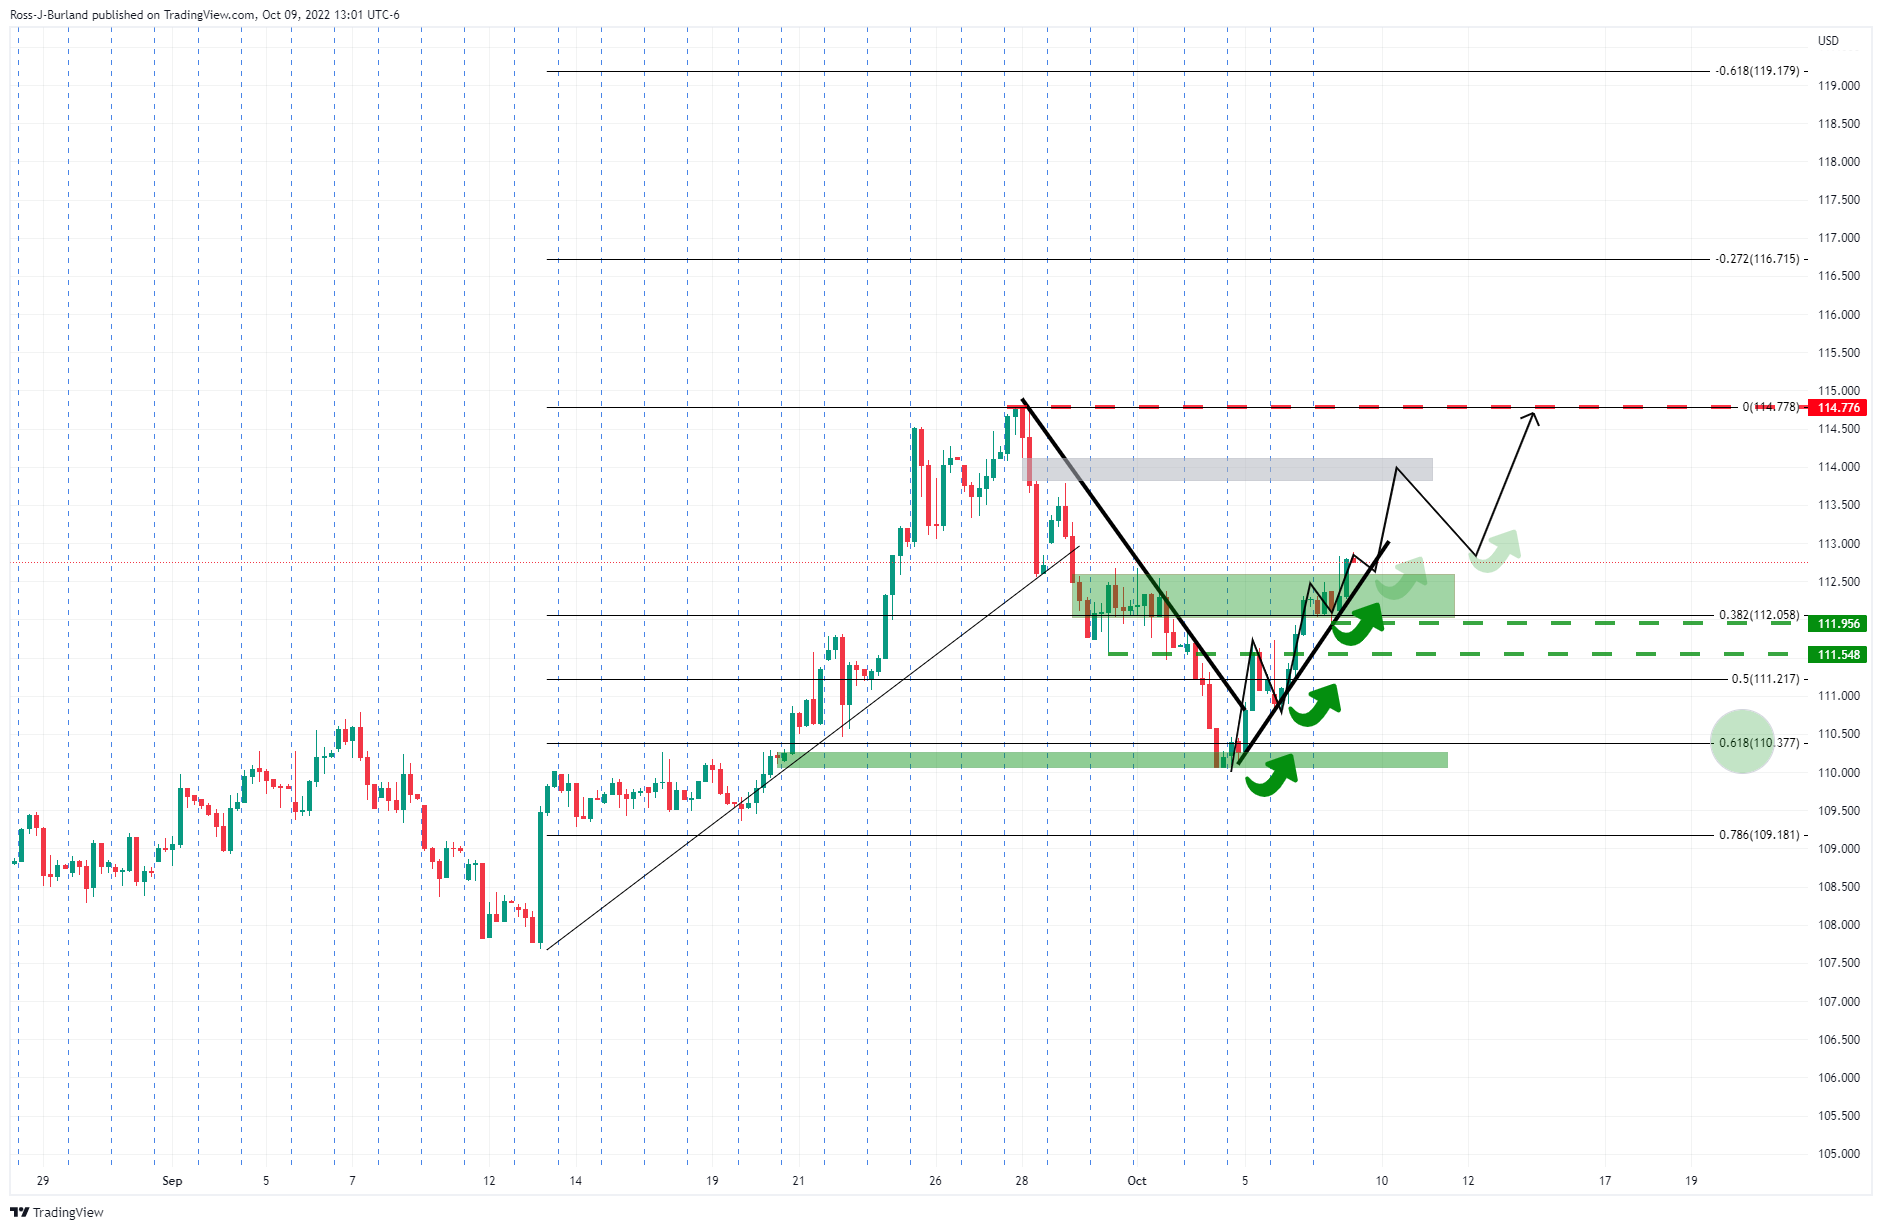
We have seen a 62% retracement in the September rally and an attempt to move higher again on the front side of a dynamic supporting trendline that is yet to give. There is a price imbalance in the grey area around 114.00 that the bulls can target for the week ahead into the Consumer Price Index (CPI).
Analysts at TD Securities argued that the ''NFP should be broadly neutral for the USD at this time, and should defer market focus to the upcoming CPI report to stake a deeper claim in the near-term direction. We are wary that a move above 145 in USDJPY will compel FX intervention, which could be more likely given upcoming CPI (especially if stronger). That could introduce temporary USD drag. Nonetheless, the USD remains best in class, and we look to accumulate on dips.''
Premium
You have reached your limit of 3 free articles for this month.
Start your subscription and get access to all our original articles.
Author

Ross J Burland
FXStreet
Ross J Burland, born in England, UK, is a sportsman at heart. He played Rugby and Judo for his county, Kent and the South East of England Rugby team.


