Gold Price Forecast: XAU/USD battling to attract buyers

XAU/USD Current price: $3,339.52
- Upbeat US data backed a Wall Street’s recovery and limited US Dollar’s advance.
- US President Trump hinted at potential trade deals with Europe and India.
- XAU/USD bounced from fresh weekly lows, bullish potential well-limited.
Gold price hovers around $3,340, recovering from a fresh weekly low of $3,309.96. The FX board is all about United States (US) headlines and sentiment. The US Dollar (USD) traded with a firmer tone throughout the day, partially backed by comments from US President Donald Trump, hinting at trade deals with India and the Eurozone, and partially supported by upbeat macroeconomic figures.
Retail Sales in the US surged my more than anticipated in June, up 0.6% after falling by 0.9% in May and much better than the 0.1% advance anticipated. Additionally, Initial Jobless Claims in the week ended July 12 rose by 221K, beating the 235K expected. Finally, the Philadelphia Fed Manufacturing Survey improved to 15.9 in July from the -4 posted in June, much better than the -1 anticipated by market’s analysts.
The upbeat figures boosted Wall Street, with the three major indexes rallying, limiting USD demand in the second half of the day. At the same time, the XAU/USD pair got to bounce from the aforementioned low, amid speculative interest betting on higher highs ahead for the bright metal.
Meanwhile, speculative interest has set aside concerns about the Federal Reserve (Fed) autonomy, after US President Donald Trump poured could water on speculation he may replace Fed’s Chair, Jerome Powell, before the end of his term in May 2026.
Friday will bring the preliminary estimate of the July Michigan Consumer Sentiment Index, expected to have improved to 61.5 from the 60.7 posted in June.
XAU/USD short-term technical outlook
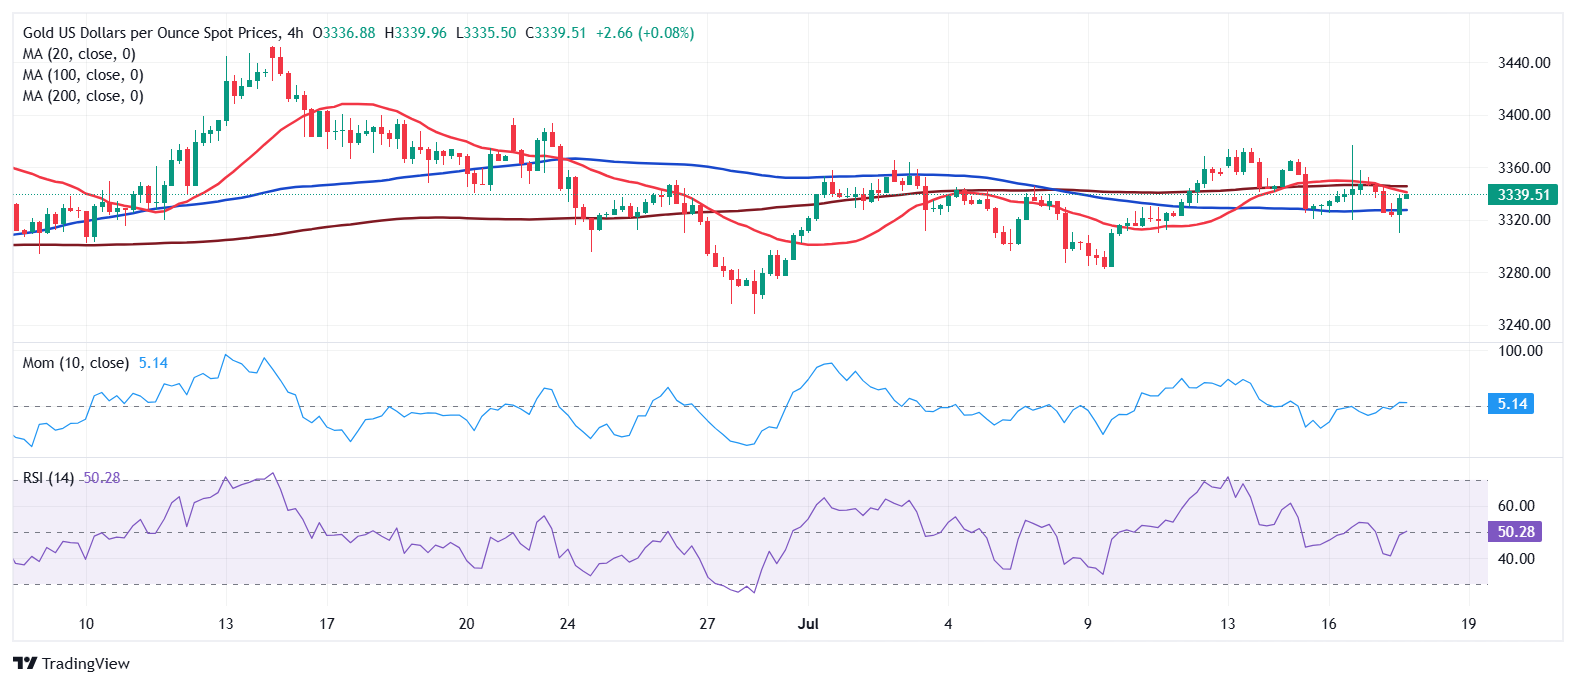
The quick bounce in Gold despite the better mood suggests buyers are still willing to add on dip. The daily chart for the XAU/USD pair temporarily fell below the 38.2% retracement of the $3,452.51 - $3,247.83 decline at around $3,325, while sellers contained advances around the 50% retracement of the same decline at around $3,350. The same chart shows that the pair is currently a handful of bucks above a flat 20 Simple Moving Average (SMA), while the 100 and 200 SMAs extended their advances far below the current level. Technical indicators, in the meantime, diverge within neutral levels, failing to provide clear directional clues.
The near term picture shows the bullish potential is limited, as the pair would need to run past the next Fibonacci resistance, the 61.8% retracement at $3,374.56, to turn positive. The 4-hour chart shows a mildly bearish 20 SMA extends its slide below a flat 200 SMA, while technical indicators recovered from their early lows near oversold readings, but remain within negative levels.
Support levels: 3,325.00 3,311.70 3,295.50
Resistance levels: 3,350.18 3,374.56 3,390.10
Premium
You have reached your limit of 3 free articles for this month.
Start your subscription and get access to all our original articles.
Author

Valeria Bednarik
FXStreet
Valeria Bednarik was born and lives in Buenos Aires, Argentina. Her passion for math and numbers pushed her into studying economics in her younger years.


