Gold Price Forecast: XAU/USD battles to retain the $3,300 mark

XAU/USD Current price: $3,298.25
- Upbeat S&P Global May PMIs helped the US Dollar during US trading hours.
- Wall Street trades in the green, but holds on to weekly losses.
- XAU/USD lost some upward steam, but the downside remains well-limited.
Spot Gold trades around the $3,300 mark, down from an early peak of $3,345.48. The US Dollar (USD) traded mixed across the FX board throughout the first half of the day, retaining the negative bias amid persistent concerns. Asian and European indexes closed in the red, reflecting the dismal mood.
The Greenback, however, found near-term support on upbeat United States (US) data. S&P Global released the flash estimate of the May Purchasing Managers’ Index (PMI), which showed manufacturing output improved to 52.3 from 50.2 in April, while the Services PMI rose to 52.3 from 50.8 in the same period. As a result, the Composite PMI surged to 52.1 after posting 50.6 in April, a two-month high.
Wall Street recovered some of the ground lost in the previous sessions, holding on to the green on a daily basis, albeit down for the week. Concerns about the US President Donald Trump’s tax bill and tariffs’ effects on economic growth were partially offset by data, yet remain in the background.
XAU/USD short-term technical outlook
The daily chart for the XAU/USD pair shows it posted a higher high and a lower low, but buyers keep defending the downside at around a flat 20 Simple Moving Average (SMA), providing support at around $3,288.00. The same chart shows that the 100 and 200 SMAs keep grinding north far below the current level, in line with the dominant bullish trend. Finally, technical indicators lost their bullish strength, but turned flat within positive levels, limiting the odds for a steeper decline.
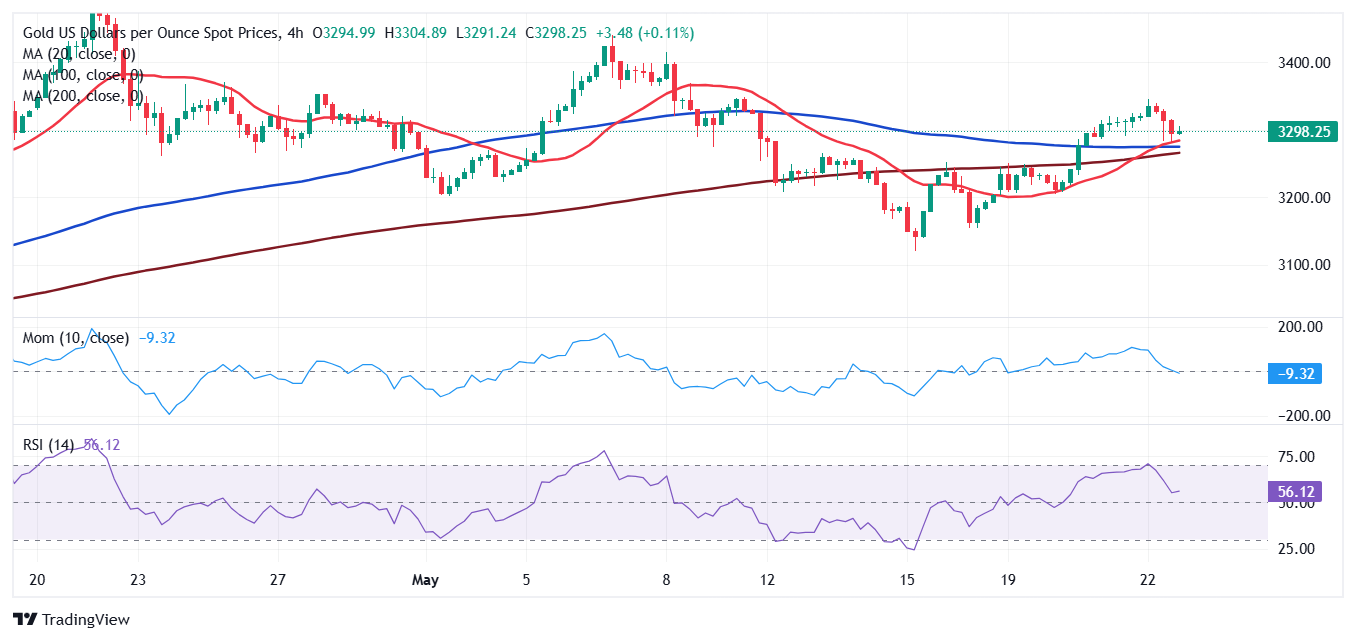
In the near term, and according to the 4-hour chart, Gold lost upward steam, but there are no signs it could fall further. The XAU/USD pair keeps trading above all its moving averages, with the 20 SMA crossing above directionless 100 and 200 SMAs. Technical indicators, in the meantime, aim lower, although with limited strength and still holding above their midlines.
Support levels: 3,289.20 3,271.55 3,252.40
Resistance levels: 3,325.00 3,345.50 3,358.40
Premium
You have reached your limit of 3 free articles for this month.
Start your subscription and get access to all our original articles.
Author

Valeria Bednarik
FXStreet
Valeria Bednarik was born and lives in Buenos Aires, Argentina. Her passion for math and numbers pushed her into studying economics in her younger years.


