Gold Price Forecast: XAU/USD aims north ahead of Fed’s announcement

XAU/USD Current price: $4,200
- The Federal Reserve is set to announce its decision on monetary policy.
- Market players will be looking for clues on the Fed’s upcoming path.
- XAU/USD is neutral-to-bullish in the near term, aims to resume its long-term bullish trend.
Gold price kept seesawing around the $4,200 mark throughout the first half of Wednesday, unable to attract investors. The FX board has been quiet due to the absence of a clear directional catalyst, exacerbated by the United States (US) government shutdown and the resulting uncertainty, which affected even the Federal Reserve (Fed)’s odds for a December interest rate cut.
However, the release of soft employment-related figures revived speculation that the central bank will deliver. And the day has come, the Fed is expected to announce a 25 basis points (bps) interest rate cut following its two-day meeting in the upcoming American afternoon.
Beyond the rate cut, policymakers are also expected to share their views on economic progress and monetary policy through the Summary of Economic Projections (SEP). Finally, Chairman Jerome Powell will hold a press conference, in which he will explain the officials' reasoning beyond the decision. Market participants will be looking for clues on the interest rate path for 2026 and 2027.
Ahead of the announcement, the US Dollar (USD) trades with a soft tone while stocks maintain a positive bias. Should the Fed cut rates as expected and hint at more than one rate cut in the foreseeable future, such trends are likely to continue.
XAU/USD short-term technical outlook
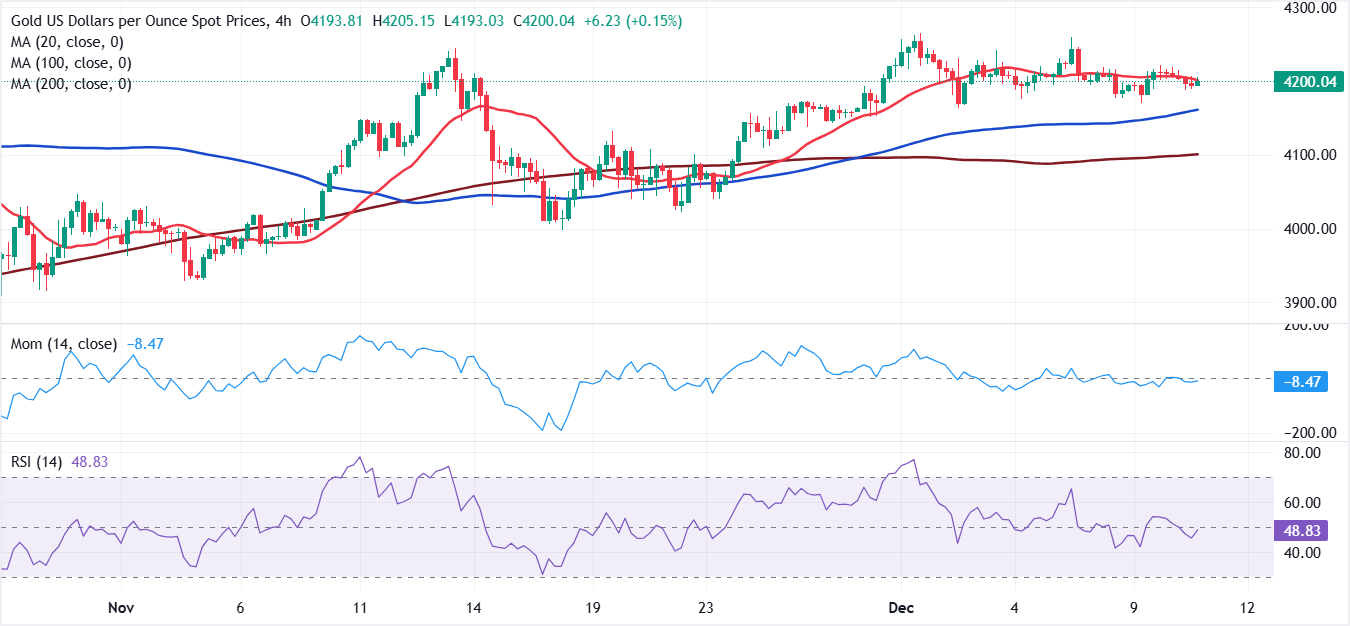
In the 4-hour chart, XAU/USD trades at $4,201.02, slightly below its daily opening. The 20-period Simple Moving Average (SMA) has flattened just above the current level and edges marginally lower. At the same time, the 100- and 200-period SMAs continue to rise well below the current level, preserving a medium-term bullish bias. Support aligns with the 100-period SMA at $4,161.04, while the 200-period SMA at $4,100.74 underpins the broader trend. In the meantime, the Momentum indicator remains below 0 and edges higher, while the Relative Strength Index (RSI) sits at 49 (neutral) and turns up, indicating sellers are losing steam.
XAU/USD daily chart shows that the 20-day SMA climbs above the 100- and 200-day SMAs, and all three slope higher, highlighting sustained bullish pressure. Price holds above its key averages, with the 20-day SMA at $4,153.07 offering nearby dynamic support. Finally, the Momentum indicator remains above its midline but eases, pointing to modest deceleration in buying interest, while the RSI indicator stands at 59, consistent with a positive tone.
(The technical analysis of this story was written with the help of an AI tool)
Premium
You have reached your limit of 3 free articles for this month.
Start your subscription and get access to all our original articles.
Author

Valeria Bednarik
FXStreet
Valeria Bednarik was born and lives in Buenos Aires, Argentina. Her passion for math and numbers pushed her into studying economics in her younger years.


