XAU/USD Current price: $2,378.85
- Financial markets turn cautious ahead of central banks’ announcements.
- The Federal Reserve is likely to pave the way for a September rate cut this week.
- XAU/USD tunrned neutral-to-bearish in the near term, critical support at $2,366.
Spot Gold turned south after Wall Street’s opening and after spending the first half of the day consolidating just below $2,400. XAU/USD fell towards $2,369.57 and trades nearby as investors gear up for critical events spread throughout the week. Financial markets started the week with a firm footing, with Asian stocks posting substantial gains. European indexes, on the contrary, lost ground, leading to a tepid performance among their United States (US) counterparts.
US indexes hold on to modest intraday gains at the moment, with speculative interest focused on upcoming earnings reports and central banks’ decisions. The Bank of Japan (BoJ) will announce its decision on monetary policy early on Wednesday, followed later in the day by the US Federal Reserve (Fed). Finally, the Bank of England (BoE) will unveil its decision on Thursday.
Ahead of the announcements, financial markets are pricing in some adjustments. The BoJ is foreseen to reduce the monthly purchases of Japan Government Bonds (JGB), while the Fed is likely to pave the way for a September cut. As for the BoE, market players anticipate a 25 basis point (bps) rate cut.
XAU/USD short-term technical outlook
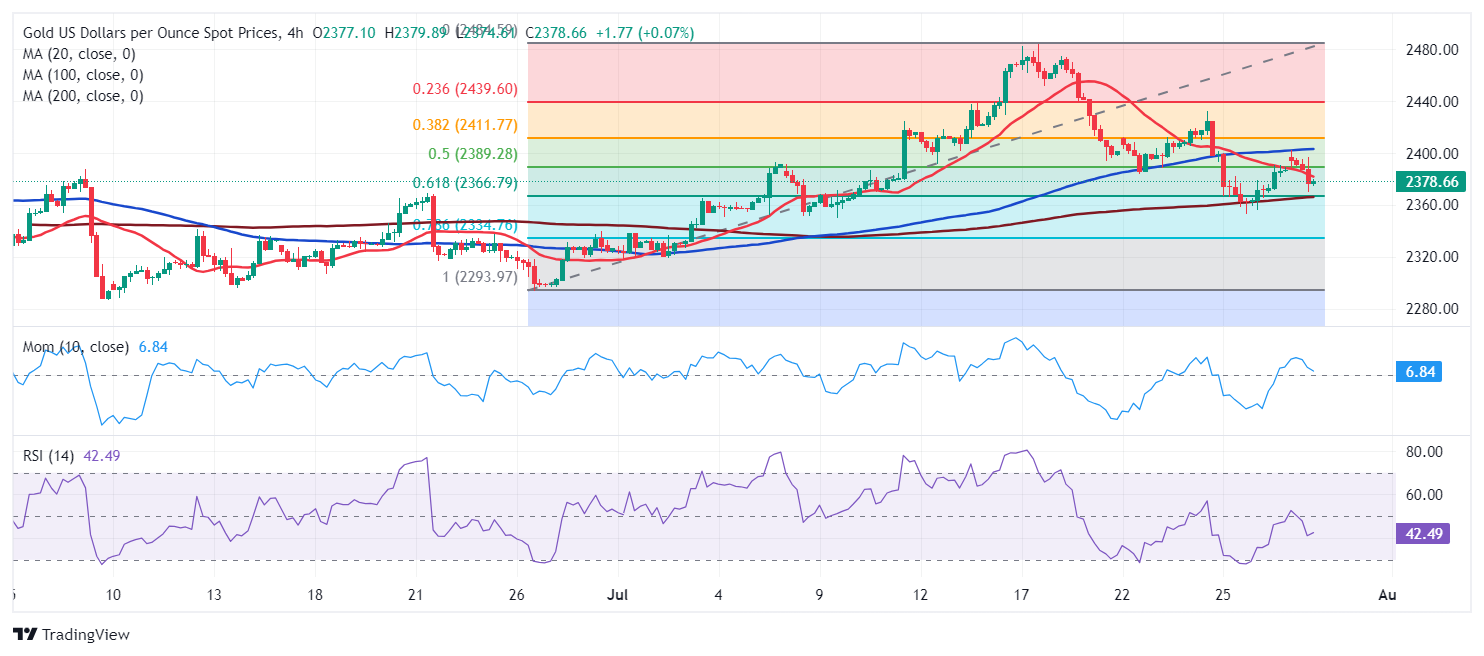
The daily chart for XAU/USD shows the risk skews to the downside, although additional confirmation is required. The bright metal trades below a still bullish 20 Simple Moving Average (SMA), but technical indicators turned back south within neutral levels. At the same time, the pair is approaching the 61.8% Fibonacci retracement of its June/July run at $2,366.30, the immediate support level. The 50% retracement at 2,403.10 acts as near-term resistance.
Technical readings in the 4-hour chart offer a neutral-to-bearish stance. XAU/USD is currently trading below a bearish 20 SMA, while a mildly bearish 200 SMA reinforces the support at around $2,366.00. Technical indicators, in the meantime, lack directional strength, with the Relative Strength Index (RSI) indicator currently consolidating at around 42, skewing the risk to the downside without confirming it.
Support levels: 2,366.30 2,353.00 2,339.65
Resistance levels: 2,388.25 2,403.10 2,418.15
Information on these pages contains forward-looking statements that involve risks and uncertainties. Markets and instruments profiled on this page are for informational purposes only and should not in any way come across as a recommendation to buy or sell in these assets. You should do your own thorough research before making any investment decisions. FXStreet does not in any way guarantee that this information is free from mistakes, errors, or material misstatements. It also does not guarantee that this information is of a timely nature. Investing in Open Markets involves a great deal of risk, including the loss of all or a portion of your investment, as well as emotional distress. All risks, losses and costs associated with investing, including total loss of principal, are your responsibility. The views and opinions expressed in this article are those of the authors and do not necessarily reflect the official policy or position of FXStreet nor its advertisers. The author will not be held responsible for information that is found at the end of links posted on this page.
If not otherwise explicitly mentioned in the body of the article, at the time of writing, the author has no position in any stock mentioned in this article and no business relationship with any company mentioned. The author has not received compensation for writing this article, other than from FXStreet.
FXStreet and the author do not provide personalized recommendations. The author makes no representations as to the accuracy, completeness, or suitability of this information. FXStreet and the author will not be liable for any errors, omissions or any losses, injuries or damages arising from this information and its display or use. Errors and omissions excepted.
The author and FXStreet are not registered investment advisors and nothing in this article is intended to be investment advice.
Recommended Content
Editors’ Picks

EUR/USD hits two-week tops near 1.0500 on poor US Retail Sales
The selling pressure continues to hurt the US Dollar and now encourages EUR/USD to advance to new two-week peaks in levels just shy of the 1.0500 barrier in the wake of disappointing results from US Retail Sales.

GBP/USD surpasses 1.2600 on weaker US Dollar
GBP/USD extends its march north and reclaims the 1.2600 hurdle for the first time since December on the back of the increasing downward bias in the Greenback, particularly exacerbated following disheartening US results.

Gold maintains the bid tone near $2,940
The continuation of the offered stance in the Greenback coupled with declining US yields across the board underpin the extra rebound in Gold prices, which trade at shouting distance from their record highs.

Weekly wrap: XRP, Solana and Dogecoin lead altcoin gains on Friday
XRP, Solana (SOL) and Dogecoin (DOGE) gained 5.91%, 2.88% and 3.36% respectively on Friday. While Bitcoin (BTC) hovers around the $97,000 level, the three altcoins pave the way for recovery and rally in altcoins ranking within the top 50 cryptocurrencies by market capitalization on CoinGecko.

Tariffs likely to impart a modest stagflationary hit to the economy this year
The economic policies of the Trump administration are starting to take shape. President Trump has already announced the imposition of tariffs on some of America's trading partners, and we assume there will be more levies, which will be matched by foreign retaliation, in the coming quarters.

The Best Brokers of the Year
SPONSORED Explore top-quality choices worldwide and locally. Compare key features like spreads, leverage, and platforms. Find the right broker for your needs, whether trading CFDs, Forex pairs like EUR/USD, or commodities like Gold.