Gold Price Forecast: Will US inflation trigger a sustained move above $1,834 in XAU/USD?
- Gold price off highs but its bullish potential remains intact.
- US inflation eyed for hints on the timing of the Fed rate hike.
- Gold price needs a daily close above $1,834 to extend the technical breakout.

The buying interest around gold price remained unabated on Tuesday, as the bright metal refreshed two-month highs at $1,833, falling a thread-line short of the September highs of $1,834. Gold price extended its bullish momentum into a fourth straight day, as the US dollar continued its corrective downside, tracking the persistent weakness in the Treasury yields across the curve. Investors weighed in the global central bankers’ reluctance to signal a rate hike amid growing inflation worries, which underpinned the underlying bullish tone in gold price. Additionally, the passage of the US $1 trillion infrastructure bill provided the much-need tailwind to gold’s upsurge. Gold jumped nearly 2% last Friday on the Fed’s and the Bank of England’s (BOE) dovish stance.
Gold price is retreating in the lead-up to the US inflation showdown, which is eagerly awaited by the markets for any hints on the Fed’s rate hike timing, as well as, its pace of tapering in the coming months. The metal is easing from two-month tops, as the US dollar has caught a fresh bid amid escalating inflation concerns, especially after the Chinese Consumer Price Index (CPI) and Producer Price Index (PPI) jumped amid power crunch. Record high Chinese PPI intensified the risk-off mood, lifting the safe-haven demand for the greenback. All eyes now remain on the US inflation figures for the next decisive move in gold price. The US CPI is expected to arrive at 5.3% YoY in October vs. 5.4% previous while the core figure is seen steady at 4% in the reported period.
Gold Price Chart - Technical outlook
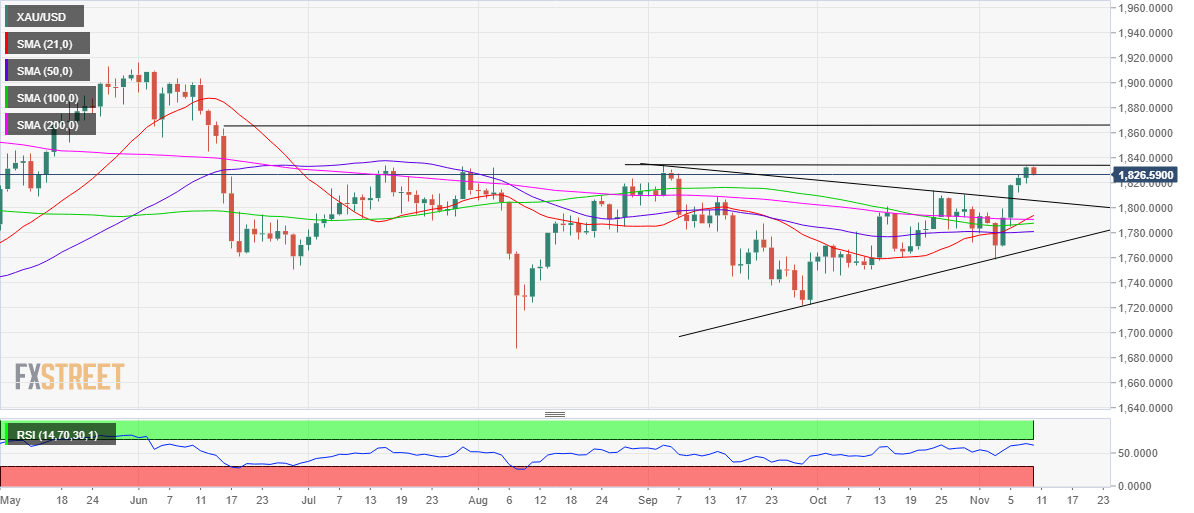
Gold: Daily chart
Gold price has turned south after running into strong offers on a couple of occasions just below the September highs.
The latest leg lower can be associated with the downtick in the 14-day Relative Strength Index (RSI). With the leading indicator, however, still holding comfortably above the 50.00 level, gold’s bullish potential remains well in place.
Adding credence to the bullish bias, a bull cross, represented by the 21-Daily Moving Average (DMA) having pierced the 200-DMA from below, remains in play.
Gold bulls need a daily closing above the $1,834 barrier to unleash the further upside. The next stop for gold buyers is seen at the $1,840 round number, above which the June 16 high of $1,853 could likely be tested.
Should the bears manage to defend the September tops, the further retracement towards Tuesday’s low of $1819 could be in the offing.
Further south, symmetrical triangle resistance-turned-support at $1,806 will emerge as a powerful support.
Note that gold price yielded an upside breakout from the symmetrical triangle formation last Friday.
Premium
You have reached your limit of 3 free articles for this month.
Start your subscription and get access to all our original articles.
Author

Dhwani Mehta
FXStreet
Residing in Mumbai (India), Dhwani is a Senior Analyst and Manager of the Asian session at FXStreet. She has over 10 years of experience in analyzing and covering the global financial markets, with specialization in Forex and commodities markets.


