Gold Price Forecast: Speculative interest keeps buying the dips
- Tensions between the US and China weighed on the market’s mood.
- Central banks keep pumping liquidity as Q2 growth figures point to a steeper downturn.
- Spot gold set to extend its gains beyond a multi-year high of 1,765.19.

Gold prices have reached fresh multi-year highs this week, with spot hitting $ 1,765.19 a troy ounce. Despite ending the week in the red, the bright metal holds on to its bullish potential, backed by renewed tensions between the US and China, and central bankers keeping the stimulus tap open.
Optimism surged at the beginning of the week amid news that Moderna pharmaceutic’s test on its vaccine gave positive results on a small sample. The company entered a new phase of testing and said it could have a vaccine by year-end. The Moderna vaccine is the most advanced one, but there are other companies in different stages of testing. Economic reopenings also lifted the mood, although concerns over a second wave on contagions partially offset the positive headlines.
Central banks and coronavirus
The FOMC released the Minutes of its latest meeting this week, and while the document didn’t bring shocking news, clearly indicated that policymakers are willing to use any available tool to support the economy through the pandemic, except negative rates. The BOE, on the other hand, had put them on the table. Meanwhile, the BOJ announced a 30 trillion yen program to support small and medium-sized companies.
Tensions between the US and China escalated as the week went by, denting the market’s sentiment. The US launched an investigation on the origins of COVID-19 backed, among others by Australia. It also menaced to take measures against the Chinese government’s decision to impose national security legislation on Hong Kong, triggering a response from US President Trump, who said that the country would “address that issue very strongly.”
In this scenario, that’s meant to persist, gold will continue to attract investors.
Data released these last few days indicate that the economic downturn will steepen into Q2. A bounce in manufacturing output and the services sector from record lows fell short of indicating some kind of growth. The number of unemployed people n the US continued to increase by the millions, and inflation continues to fall.
The US calendar will have little to offer until Thursday when the country will release April Durable Goods Orders and the first revision of Q1 GDP.
Spot Gold Technical Outlook
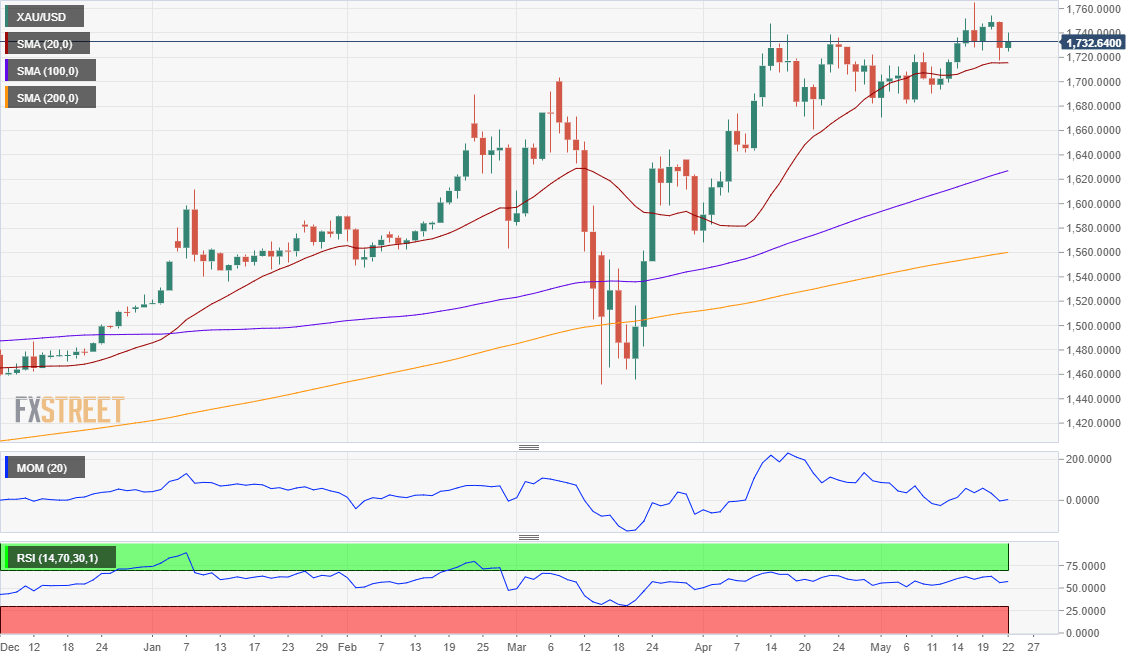
Spot gold recovered this Friday after falling to a weekly low of 1,717.17 on Thursday. Now trading around 1,735, it has posted a higher high and a higher low for a second consecutive week, a sign that the bullish pressure is still high.
In the weekly chart, technical readings maintain the risk skewed to the upside, as the metal stands above all of its moving averages, and with the 20 SMA maintaining its upward slope far above the larger ones. Technical indicators lack directional strength, but remain well into positive ground and close to overbought levels.
In the daily chart, the metal offers a neutral-to-bullish stance. The pair bottomed near a now flat 20 DMA, while technical indicators have turned flat within positive levels. The 100 and 200 SMA, maintain their strong bullish slopes far below the current level.
The 1,745 level comes as the immediate resistance, as spot stalled its intraday rallies several times in the last few weeks. Beyond it, the next relevant level is 1,753.90 ahead of the mentioned multi-year high of 1,765.19. Beyond it, bulls will try to extend its run toward 1,800.00. 1,722 is the immediate support ahead of 1,715, where the metal has its daily 20 SMA. Below it, it can test the 1,690 price zone.
Gold Sentiment Poll
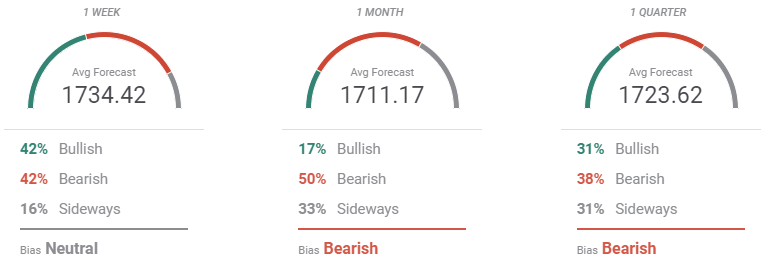
The FXStreet Forecast Poll suggests that the metal may consolidate near its highs this upcoming week, as bulls and bears are balanced. In the monthly and quarterly perspectives, bears are a majority, although on average, gold is seen holding above $1,700.00 a troy ounce.
The Overview chart shows that the range of possible targets is quite limited in the short-term, widening in the monthly view. Nevertheless, those seeing gold below 1,600 is quite a few, while the number of experts looking for 1,800 continues to increase. Moving averages have lost bullish potential in the short-term, but there are no signs of exhausting buying interest.
Related Forecasts:
EUR/USD Forecast: Feel lost? So do central bankers
AUD/USD Forecast: Relations with China reversed the rally, can an improvement revive it?
GBP/USD Forecast: Boris's Brexit and lockdown decisions stand out after the vaccine-driven rally
Author

Valeria Bednarik
FXStreet
Valeria Bednarik was born and lives in Buenos Aires, Argentina. Her passion for math and numbers pushed her into studying economics in her younger years.


