Gold Price Forecast: Sellers maintain the pressure

XAU/USD Current price: $1,814.02
- Discouraging US data and persistent inflationary pressures weigh on the market mood.
- Wall Street started the day with optimism but already trimmed most of its early gains.
- XAU/USD is bearish in the near term and about to challenge a fresh yearly low.
Spot gold fell on Monday to $1,806.50 a troy ounce, a fresh 2023 low. The US Dollar, however, lost its positive momentum during European trading hours, helping XAU/USD to bounce to the current $1,815.00 price zone. Greenback’s strength at the weekly opening was a follow-through of Friday’s advance, the latter triggered by higher-than-anticipated inflation figures.
The Federal Reserve’s (Fed) favorite inflation gauge unexpectedly surged in January, hinting at continued monetary tightening throughout 2023. American data released at the beginning of the week was also worrisome, as Durable Goods Orders fell by more than anticipated in January, down 4.5% MoM.
Meanwhile, Wall Street started the day with optimism, following positive clues from their European counterparts. Nevertheless, downbeat US figures undermined the mood, and major indexes have trimmed a good part of their intraday gains.
XAU/USD price short-term technical outlook
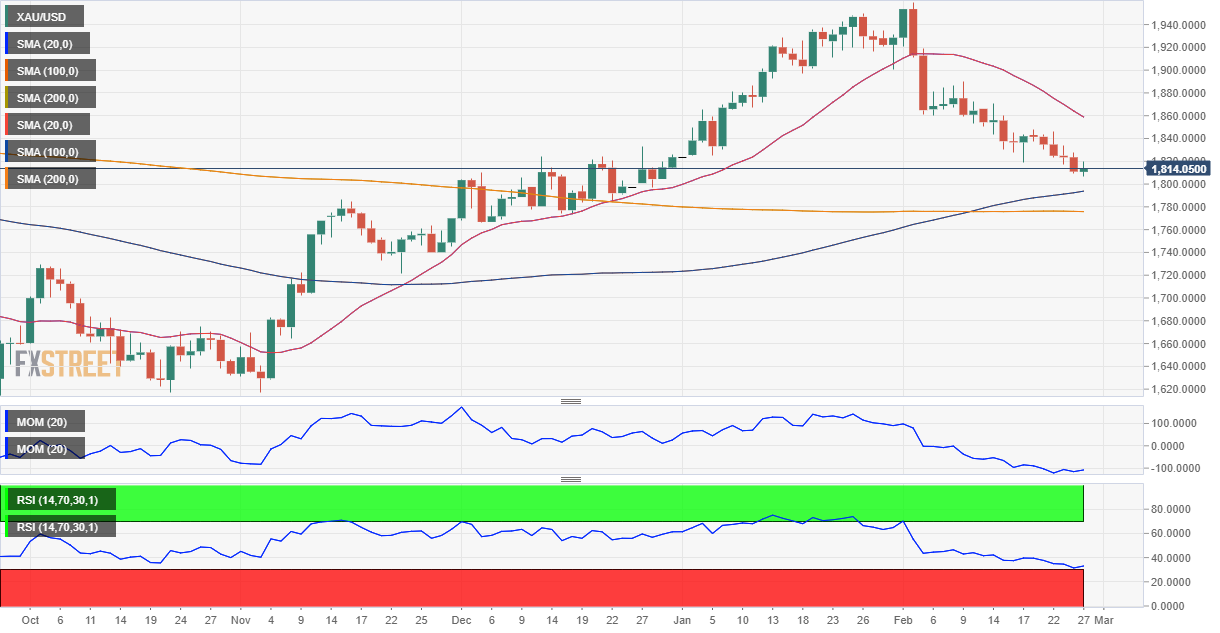
The XAU/USD pair holds on to modest intraday gains, although it posted a lower high and a lower low compared to Friday, which maintains the bearish trend alive. Technical indicators in the daily chart lack directional strength but hold within negative levels, in line with the dominant downward trend. At the same time, the 20 Simple Moving Average (SMA) has picked bearish momentum well above the current level, reflecting sellers’ strength. Finally, the 100 SMA has lost its bullish slope and currently hovers around $1,791.20, providing dynamic support.
In the near term, and according to the 4-hour chart, the risk clearly skews to the downside. XAU/USD met intraday sellers around a firmly bearish 20 SMA, while the longer moving averages head firmly south far above it. At the same time, the Momentum indicator stands directionless just below its 100 line, but the Relative Strength Index (RSI) indicator resumed its decline, heading south at around 40.
Support levels: 1,806.50 1,791.20 1,784.60
Resistance levels: 1,821.60 1,834.00 1,845.99
Premium
You have reached your limit of 3 free articles for this month.
Start your subscription and get access to all our original articles.
Author

Valeria Bednarik
FXStreet
Valeria Bednarik was born and lives in Buenos Aires, Argentina. Her passion for math and numbers pushed her into studying economics in her younger years.


