Gold Price Forecast: Near-term buyers defend the $1,830 area

XAU/USD Current price: $1,835.59
- Signs of persistently high inflation maintain market players in cautious mode.
- Government bond yields keep reaching multi-year highs amid price pressure concerns.
- XAU/USD lost upward momentum, but buyers are now defending the $1,830 area.
XAU/USD eases on Thursday as the US Dollar found some fresh impetus in concerning headlines. After hitting a one-week high of $1,844.47 a troy ounce, Gold retreated towards the $1,830 price zone. The pair staged a modest recovery after Wall Street’s opening, but the lack of momentum in stock markets limits the upside.
Inflation-related concerns dominate financial boards, along with the central banks’ possible reactions to persistent price pressures. The Eurozone published the February Harmonised Index of Consumer Prices (HICP), which rose 8.5% YoY, slightly better than the 8.6% from January. However, the reading missed the market expectations of 8.2%. Furthermore, the core annual reading printed at 5.6%, higher than the previous and expected 5.3%.
The worrisome figures came in line with European Central Bank (ECB) President Christine Lagarde's words, who said earlier in the day that, despite easing, inflation’s decline is far from stable and, anyway, remains too high. But it is not just the ECB. US Federal Reserve officials are also delivering hawkish messages, which suggest the American central bank may hike rates by more than 25 bps in the upcoming meetings.
Tensions are pushing US government bond yields higher. The 2-year Treasury yield reached a fresh multi-year high of 4.94% and currently stands at 4.91%, while the 10-year note currently offers 4.07%.
XAU/USD price short-term technical outlook
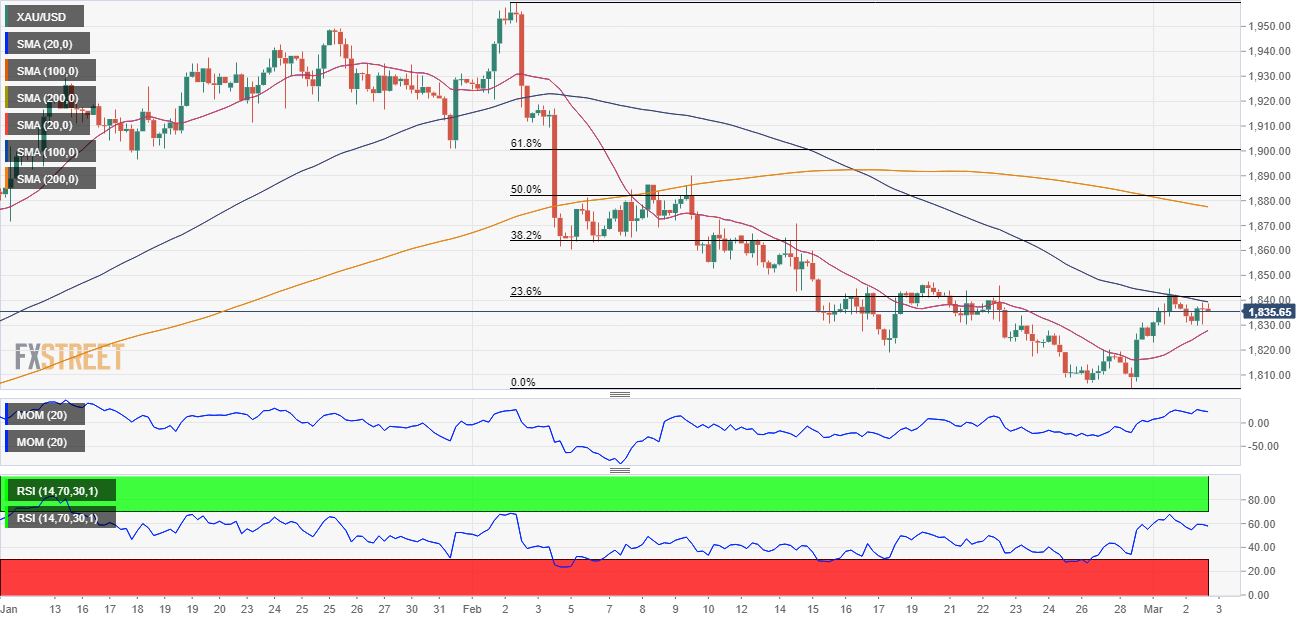
The XAU/USD pair trades at around $1,835, just below the 23.6% retracement of the $1,959.75/$1,804.70 decline at $1,841.04. Buyers are struggling to overcome the level and push the metal towards the next Fibonacci resistance level at $1,863.70.
From a technical point of view, the daily chart shows that the bullish potential is limited. The 20 Simple Moving Average (SMA) maintains its bearish slope just above the aforementioned Fibonacci level, while technical indicators head marginally lower within negative levels. On a positive note, the longer moving averages remain below the current price.
The near-term picture is neutral. The 20 SMA advances below the current level, but the 100 SMA heads south at around $1,840, reinforcing the static resistance area. At the same time, technical indicators hold within positive ground, but the RSI is flat at around 58, while the Momentum indicator heads marginally higher.
Support levels: 1,825.90 1,812.20 1,803.00
Resistance levels: 1,848.00 1,863.70 1,877.50
Premium
You have reached your limit of 3 free articles for this month.
Start your subscription and get access to all our original articles.
Author

Valeria Bednarik
FXStreet
Valeria Bednarik was born and lives in Buenos Aires, Argentina. Her passion for math and numbers pushed her into studying economics in her younger years.


