Gold crashed to $1,160 this week - its lowest level since January 2017.

The sell-off trapped me on the wrong side of the market as I was expecting the corrective rally to gather pace this week, the rationale being a solid defense of the $1,200 mark in the first ten days of this month and the bullish 14-day RSI divergence, sharp drop in demand for gold put options, and a favorable seasonal factors.

Moreover, the turmoil in Turkey put a bid under the greenback - the new safe haven currency and gold's biggest nemesis - consequently, the yellow metal took a beating.

As of now, the yellow metal is trading at $1,178 and is looking most oversold since July 13, according to the 14-week relative strength index (RSI).

Weekly chart

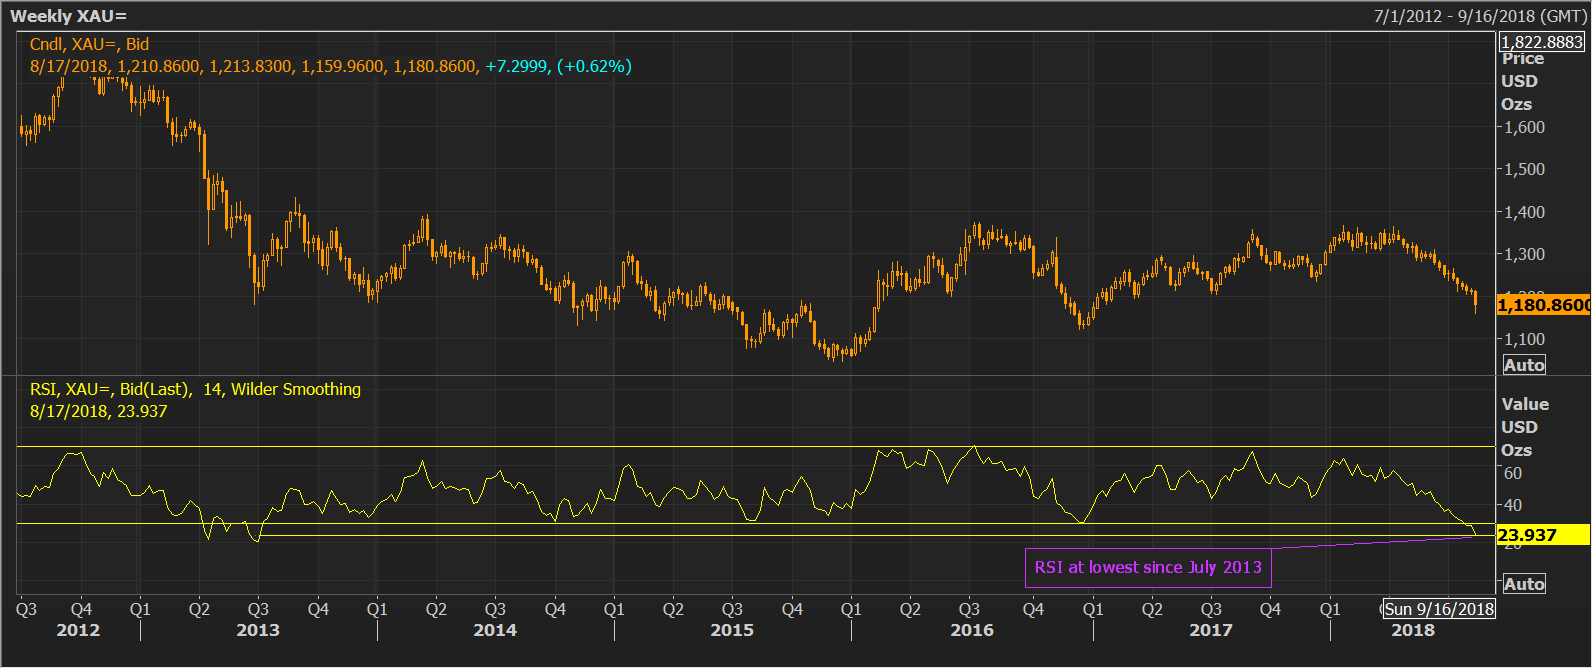
As seen in the above chart, the RSI is currently located at 24.00, the lowest level since July 2013. As a result, gold could stabilize around $1,180 in the next week.

Daily chart

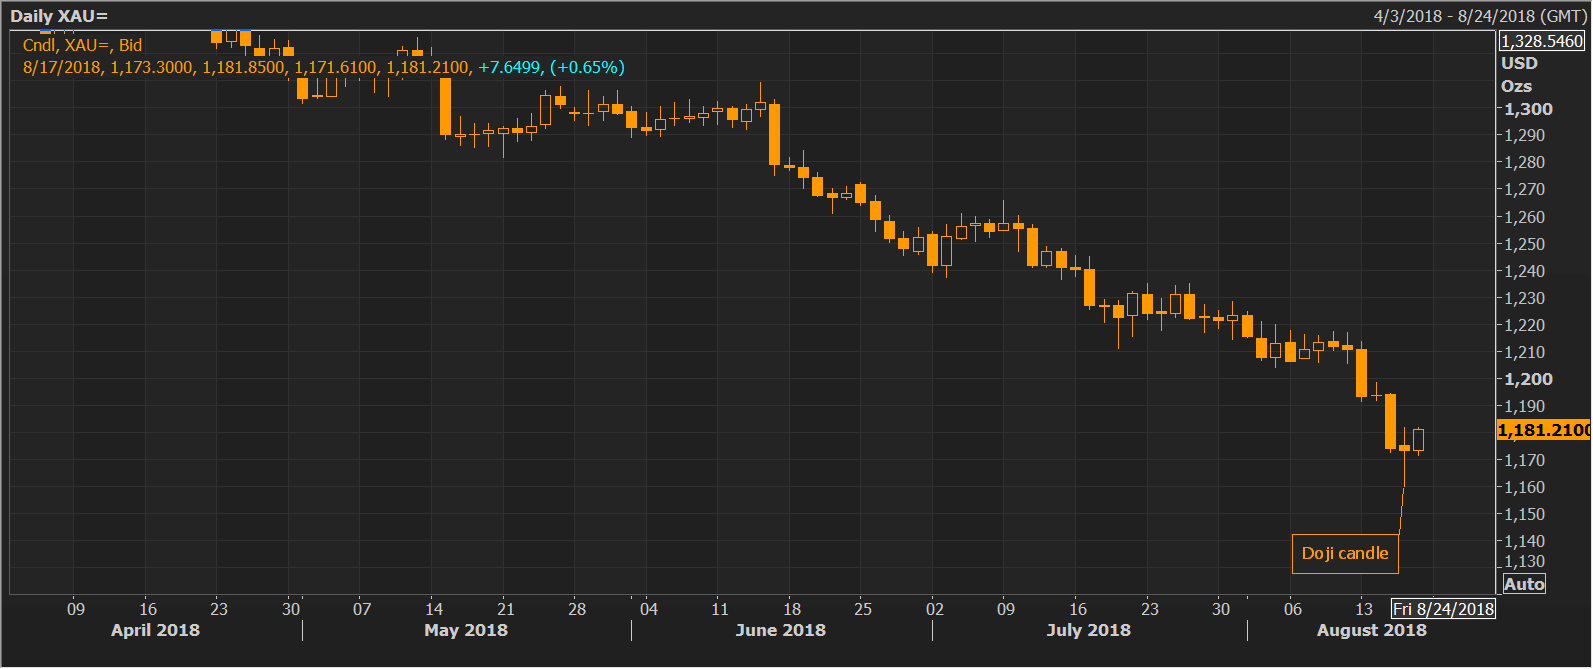
The yellow metal created a large doji candle on Thursday, signaling indecision in the marketplace. However, when viewed against the backdrop of the 15 percent drop from the April high of $1,365, the big doji candle indicates bearish exhaustion and adds credence to extreme oversold conditions called by the 14-week RSI.

View

The sell-off will likely stall in the coming week courtesy of bearish exhaustion (Thursday's doji candle) and the oversold weekly RSI.

However, a stronger corrective rally will likely unfold only if the yellow metal defends and consolidates above $1,172 (61.8 percent Fibonacci retracement of the rally from the 2015 low to 1016 high) in the next week. 

Further, it is worth noting that the upside will likely be capped around $1,210 in the near-term as long as the 5-week and 10-week moving averages (MAs) are trending south, indicating a bearish setup.

Bearish scenario: The metal could drop to $1,122 (December 2016 low) if prices consolidate in the next couple of weeks, allowing the weekly and the daily RSI to position in a more bear-friendly manner, before finding acceptance below $1,172 (61.8 percent Fibonacci retracement).

Information on these pages contains forward-looking statements that involve risks and uncertainties. Markets and instruments profiled on this page are for informational purposes only and should not in any way come across as a recommendation to buy or sell in these assets. You should do your own thorough research before making any investment decisions. FXStreet does not in any way guarantee that this information is free from mistakes, errors, or material misstatements. It also does not guarantee that this information is of a timely nature. Investing in Open Markets involves a great deal of risk, including the loss of all or a portion of your investment, as well as emotional distress. All risks, losses and costs associated with investing, including total loss of principal, are your responsibility. The views and opinions expressed in this article are those of the authors and do not necessarily reflect the official policy or position of FXStreet nor its advertisers. The author will not be held responsible for information that is found at the end of links posted on this page.

If not otherwise explicitly mentioned in the body of the article, at the time of writing, the author has no position in any stock mentioned in this article and no business relationship with any company mentioned. The author has not received compensation for writing this article, other than from FXStreet.

FXStreet and the author do not provide personalized recommendations. The author makes no representations as to the accuracy, completeness, or suitability of this information. FXStreet and the author will not be liable for any errors, omissions or any losses, injuries or damages arising from this information and its display or use. Errors and omissions excepted.

The author and FXStreet are not registered investment advisors and nothing in this article is intended to be investment advice.

Recommended Content


Recommended Content

Editors’ Picks

AUD/USD hovers around 0.6500 amid light trading, ahead of US GDP

AUD/USD hovers around 0.6500 amid light trading, ahead of US GDP

AUD/USD is trading close to 0.6500 in Asian trading on Thursday, lacking a clear directional impetus amid an Anzac Day holiday in Australia. Meanwhile, traders stay cautious due ti risk-aversion and ahead of the key US Q1 GDP release. 

AUD/USD News

USD/JPY finds its highest bids since 1990, near 155.50

USD/JPY finds its highest bids since 1990, near 155.50

USD/JPY keeps breaking into its highest chart territory since June of 1990 early Thursday, testing 155.50 for the first time in 34 years as the Japanese Yen remains vulnerable, despite looming Japanese intervention risks. Focus shifts to Thursday's US GDP report and the BoJ decision on Friday. 

USD/JPY News

Gold price treads water near $2,320, awaits US GDP data

Gold price treads water near $2,320, awaits US GDP data

Gold price recovers losses but keeps its range near $2,320 early Thursday. Renewed weakness in the US Dollar and the US Treasury yields allow Gold buyers to breathe a sigh of relief. Gold price stays vulnerable amid Middle East de-escalation, awaiting US Q1 GDP data. 

Gold News

Injective price weakness persists despite over 5.9 million INJ tokens burned

Injective price weakness persists despite over 5.9 million INJ tokens burned

Injective price is trading with a bearish bias, stuck in the lower section of the market range. The bearish outlook abounds despite the network's deflationary efforts to pump the price. Coupled with broader market gloom, INJ token’s doomed days may not be over yet.

Read more

Meta Platforms Earnings: META sinks 10% on lower Q2 revenue guidance Premium

Meta Platforms Earnings: META sinks 10% on lower Q2 revenue guidance

This must be "opposites" week. While Doppelganger Tesla rode horrible misses on Tuesday to a double-digit rally, Meta Platforms produced impressive beats above Wall Street consensus after the close on Wednesday, only to watch the share price collapse by nearly 10%.

Read more

Majors

Cryptocurrencies

Signatures