Gold Price Forecast: Grinding higher amid a souring market’s mood

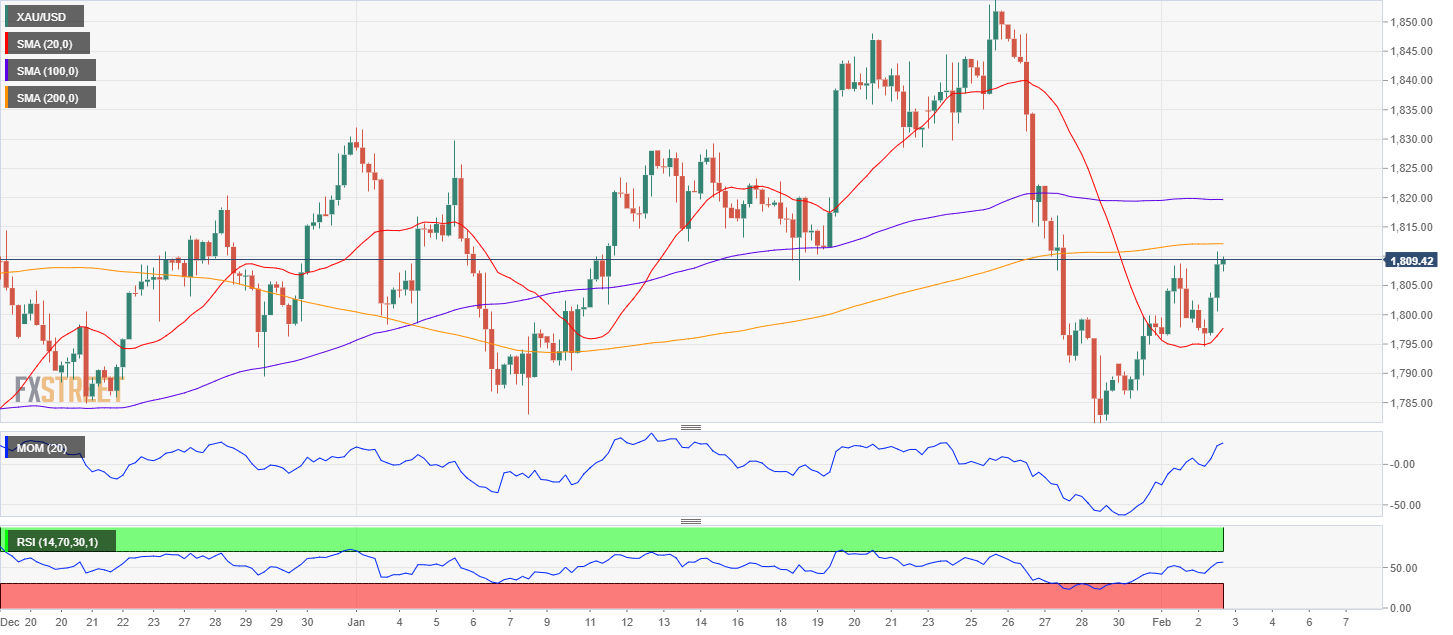
XAU/USD Current price: $1,809.43
- Soaring European inflation puts pressure on the ECB to join the tightening train.
- Concerns about US economic progress weighed on Wall Street.
- XAU/USD advances on demand for safety, investors cautious ahead of central banks.
Spot gold is trading at around $1,809.00 a troy ounce, marginally higher on a daily basis. The bright metal gained some upward traction during US trading hours, as the market’s sentiment turned sour, fueling demand for safe-haven assets. The greenback remained under pressure for most of the Asian and European sessions, as stocks maintained the positive tone while government bond yields remained near the lower end of their weekly range.
Skyrocketing European inflation, as the January annual Consumer Price Index in the EU unexpectedly jumped to 5.1%, fueled speculation that the European Central Bank will have to jump into the tightening train. US data dented the market’s sentiment, as the ADP survey showed that the private sector lost 301K job positions in January, much worse than the expected 207K gain. Wall Street turned red, with all of US indexes currently trading in the red, fearing more an economic downturn than Fed’s hawkishness.
Gold, which was stuck around the 1,800 figure, received some attention, although without abrupt movements ahead of the European Central Bank and the Bank of England monetary policy decisions on Thursday.
Gold price short-term technical outlook
The XAU/USD pair is neutral in the longer-term perspective, as the daily chart shows that it continues trading between directionless moving averages. The 100 SMA provided intraday support, despite being directionless, at around 1,795.10, while the metal remains below an also directionless 20 SMA. Technical indicators turned marginally higher but remain within negative levels.
The 4-hour chart shows that the metal has room to extend gains, despite limited bullish momentum. Gold is nearing a mildly bullish 200 SMA, while the 20 SMA aims north blow the current level. At the same time, technical indicators advance with uneven strength within positive levels, limiting the chances of an upcoming decline.
Support levels: 1,803.00 1,795.10 1,782.60
Resistance levels: 1.816.95 1,825.90 1,831.70
Premium
You have reached your limit of 3 free articles for this month.
Start your subscription and get access to all our original articles.
Author

Valeria Bednarik
FXStreet
Valeria Bednarik was born and lives in Buenos Aires, Argentina. Her passion for math and numbers pushed her into studying economics in her younger years.


