XAUUSD Current Price: $1,870.76
- Market participants are cautious ahead of the US Federal Reserve monetary policy announcement.
- The better tone of stocks markets limits the American dollar’s strength.
- XAUUSD bounced from a fresh multi-week low but is still at risk of falling.
Spot gold trades with modest gains at around $1,871.40 a troy ounce after bottoming at $1,850.34 during Asian trading hours. Fears paused on Tuesday as investors changed their focus from the usual risk factors to the upcoming US Federal Reserve monetary policy decision. Global stocks are in better shape, with most indexes posting gains, while US government bond yields retreated from their Monday peaks, reflecting decreasing demand for safe-haven assets.
Aggressive central banks have been in the eye of the storm amid overheating inflation, the latter a result of ultra-accommodative stances taken by major central banks coupled with fiscal stimulus provided by governments to boost economic activity during the pandemic. The US Fed has widely anticipated an aggressive 50 bps rate hike while hinting at reducing its balance sheet. Draining liquidity is the main message from policymakers, leading to a sharp decrease in high-yielding assets in the last few months.
Ahead of the announcement, most of its potential outcome has been priced in, and the market could well fall into a “buy the rumor, sell the fact” scheme. At the time being, the greenback retains a good chunk of its latest gains, barely correcting lower against its major rivals.
XAUUSD Technical Outlook
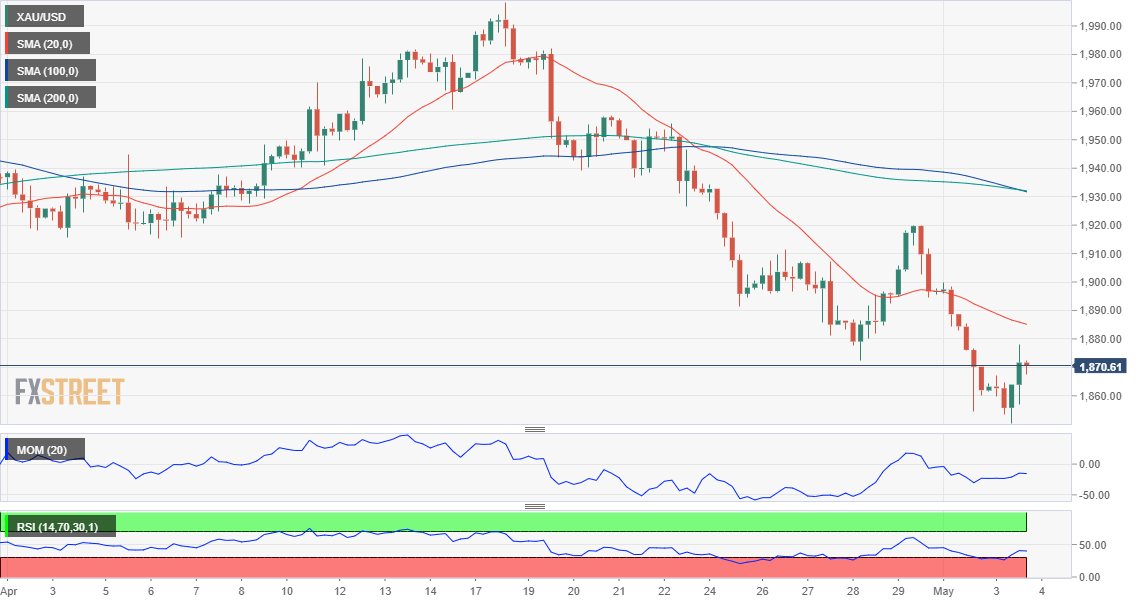
Gold Price retains its bearish stance in its daily chart, as technical indicators have barely lost their bearish strength, holding near oversold readings. Furthermore, the bright metal met intraday sellers around a flat 100 SMA, providing dynamic resistance around $1,878.10. The 20 SMA, in the meantime, accelerates south far above the longer ones.
In the near term, and according to the 4-hour chart, the risk is also skewed to the downside. The intraday rally stalled below a bearish 20 SMA, which keeps heading lower below, also bearish, the longer ones. At the same time, technical indicators remain well into negative levels, with the Momentum heading south and the RSI stable at around 40.
Support levels: 1,854.40 1,843.80 1,835.10
Resistance levels: 1,878.10 1,895.20 1,908.50
View Live Chart for the XAU/USD
Information on these pages contains forward-looking statements that involve risks and uncertainties. Markets and instruments profiled on this page are for informational purposes only and should not in any way come across as a recommendation to buy or sell in these assets. You should do your own thorough research before making any investment decisions. FXStreet does not in any way guarantee that this information is free from mistakes, errors, or material misstatements. It also does not guarantee that this information is of a timely nature. Investing in Open Markets involves a great deal of risk, including the loss of all or a portion of your investment, as well as emotional distress. All risks, losses and costs associated with investing, including total loss of principal, are your responsibility. The views and opinions expressed in this article are those of the authors and do not necessarily reflect the official policy or position of FXStreet nor its advertisers. The author will not be held responsible for information that is found at the end of links posted on this page.
If not otherwise explicitly mentioned in the body of the article, at the time of writing, the author has no position in any stock mentioned in this article and no business relationship with any company mentioned. The author has not received compensation for writing this article, other than from FXStreet.
FXStreet and the author do not provide personalized recommendations. The author makes no representations as to the accuracy, completeness, or suitability of this information. FXStreet and the author will not be liable for any errors, omissions or any losses, injuries or damages arising from this information and its display or use. Errors and omissions excepted.
The author and FXStreet are not registered investment advisors and nothing in this article is intended to be investment advice.
Recommended Content
Editors’ Picks
EUR/USD trades weak below 1.0800 amid Good Friday lull, ahead of US PCE
EUR/USD remains depressed below 1.0800, as traders lack directional impetus amid minimal volatility and thin liquidity on Good Friday. The pair keenly awaits the US PCE inflation data and Fed Chair Powell's speech for fresh hints on next week's price action.
GBP/USD holds steady above 1.2600 as markets stay calm on Good Friday
GBP/USD trades sideways above 1.2600 amid a typical Good Friday trading lull. A broadly firmer US Dollar could keep any upside attempts limited in the pair ahead of the US PCE inflation data and Fed Chair Powell's appearance.
Gold ends Q1 2024 at record highs, what’s next?
Gold is sitting at an all-time high of $2,236, lacking a trading impetus amid holiday-thinned conditions on Good Friday. Most major world markets, including the United States are closed in observance of Holy Friday, leaving volatility around Gold price highly subdued.
Ripple's move above this key level could trigger nearly 50% rally for XRP
Ripple price has overcome a critical resistance level and flipped into a support floor on the weekly time frame. This development happened while XRP tightly consolidated for roughly 250 days.
US core PCE inflation set to ease in February on month as Federal Reserve rate cut bets for June mount
The core Personal Consumption Expenditures Price Index is set to rise 0.3% MoM and 2.8% YoY in February. The revised Summary of Projections showed that policymakers upwardly revised end-2024 core PCE forecast to 2.6% from 2.4%.