Gold Price Forecast: Defending $1720 is critical for XAU/USD bulls, as focus shifts to US data
- Gold price licks its wound after the three-day rout, ahead of US data.
- Focus will remain on yields and dollar amid hawkish Fed’s stance.
- Gold’s 4H chart shows $1720 as critical support while 20-SMA is tough resistance.

Gold price fell for the third day in a row on Thursday, extending the rout amid the ongoing narrative of the Fed’s tapering chances and rising inflation expectations, which kept the bullish momentum in the US dollar and the Treasury yields intact. The recent hawkish comments from Fed Chair Jerome Powell and his colleagues suggest that the world’s most powerful central bank is on track to withdraw the pandemic stimulus sooner than expected, with rate hikes on the table in 2022.
Meanwhile, concerns over a likely US government shutdown and a rebound in the US stocks also exacerbated the pain in gold price. The rising energy crisis, with petroleum problems in the Euro area and China’s power shortages reinforced stagflation concerns, boosting the dollar’s safe-haven demand at gold’s expense. Gold price hit a fresh seven-week low of $1722 before recovering slightly to settle at $1726, still down 1% on the day.
On Thursday, gold price has staged a modest recovery from fresh seven-week lows, as the market sentiment improves amid retreating Treasury yields, capping the upside in the US dollar. Upbeat Chinese Caixin Manufacturing PMI, an aversion to the US government shutdown and a rebound in metals and energy prices seem to have revived the risk-on trades. However, the further upside in gold price remains elusive, as the Fed’s hawkish expectations will continue leading the sentiment, underpinning the yields and the dollar while weighing negatively on the non-interest-bearing gold.
Also, of note remains the US final GDP release and weekly jobless claims for fresh dollar trades. A slew of speeches from the Fed officials will be closely eyed as well.
Gold Price Chart - Technical outlook
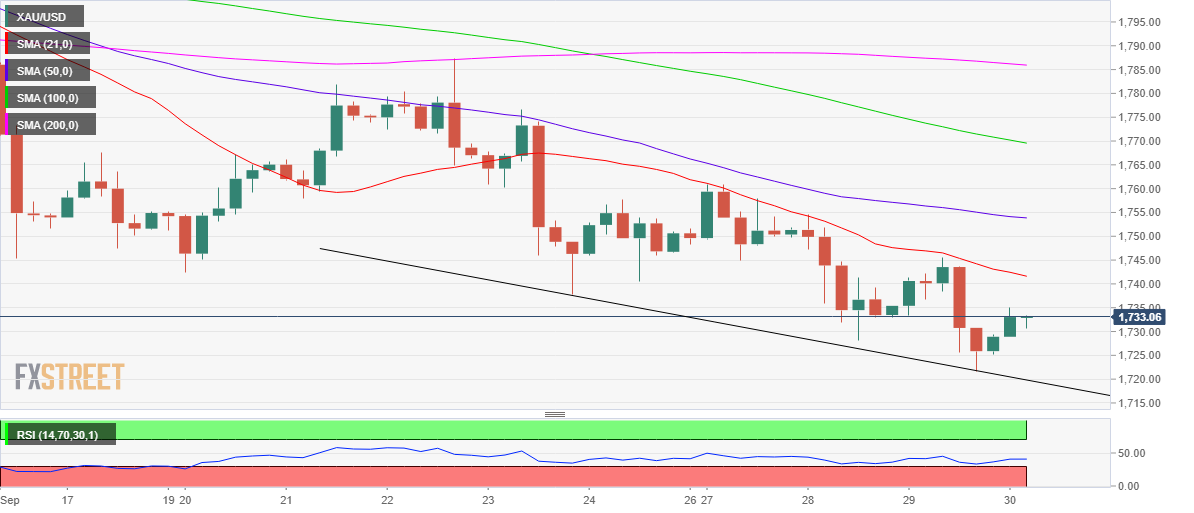
Gold: Four-hour chart
Gold’s four-hour chart shows that the price continues to extend its downtrend while trading below the 21-Simple Moving Average (SMA) at $1742.
The Relative Strength Index (RSI) turns slightly lower while below the midline, keeping the bearish view alive and kicking for gold price.
Only a four-hourly candlestick closing above the 21-SMA hurdle will create conditions for any meaningful recovery.
Up next, gold buyers will look to regain the falling 50-SMA at $1753, opening doors for a fresh rally towards the downward-sloping 100-SMA at $1770.
On the flip side, if the sellers fight back control, then a retest of the seven-week troughs at $1722 would be inevitable.
Gold bears will need to find a strong foothold below the falling trendline support at $1720, in order to flex their muscles towards the August 10 low of $1718.
The line in the sand for gold optimists is the $1700 psychological threshold.
To conclude, any recovery in gold could likely remain short-lived, as sellers would seek fresh entries at higher levels.
Author

Dhwani Mehta
FXStreet
Residing in Mumbai (India), Dhwani is a Senior Analyst and Manager of the Asian session at FXStreet. She has over 10 years of experience in analyzing and covering the global financial markets, with specialization in Forex and commodities markets.