Gold Price Forecast: Bullish breakout exposes November monthly high at 1,877.15

XAU/USD Current price: $1,841.08
- Government bond yields that soared at the beginning of the day gave up during US trading hours.
- Stocks were unable to hold on to early gains, and Wall Street trades in the red.
- XAU/USD bullish breakout set to continue ahead of Fed’s monetary policy announcement.
Spot gold trades above $1,840 a troy ounce, at levels last seen in November 2021. The bright metal soared through the American session amid persistent concerns about inflation and volatile US government bond yields. Germany confirmed the annual Consumer Price Index at 5.3% in December, its highest in almost 30 years, which sent the German 10-year bund yield trading in positive territory for the first time in almost three years. The US Treasury note yielded as much as 1.90% at the time, later retreating to the current 1.84% price zone.
Meanwhile, only European stocks managed to trade in the green, as US indexes quickly changed course after Wall Street’s opening, with major indexes now in the red. Demand for the greenback has been tepid ever since the day started, with gold advancing steadily but accelerating north after breaking through its recent highs in the 1,830 price zone.
Investors are waiting for the US Federal Reserve monetary policy announcement next week and whether policymakers will steepen tightening. The greenback may lack self-strength between now and then.
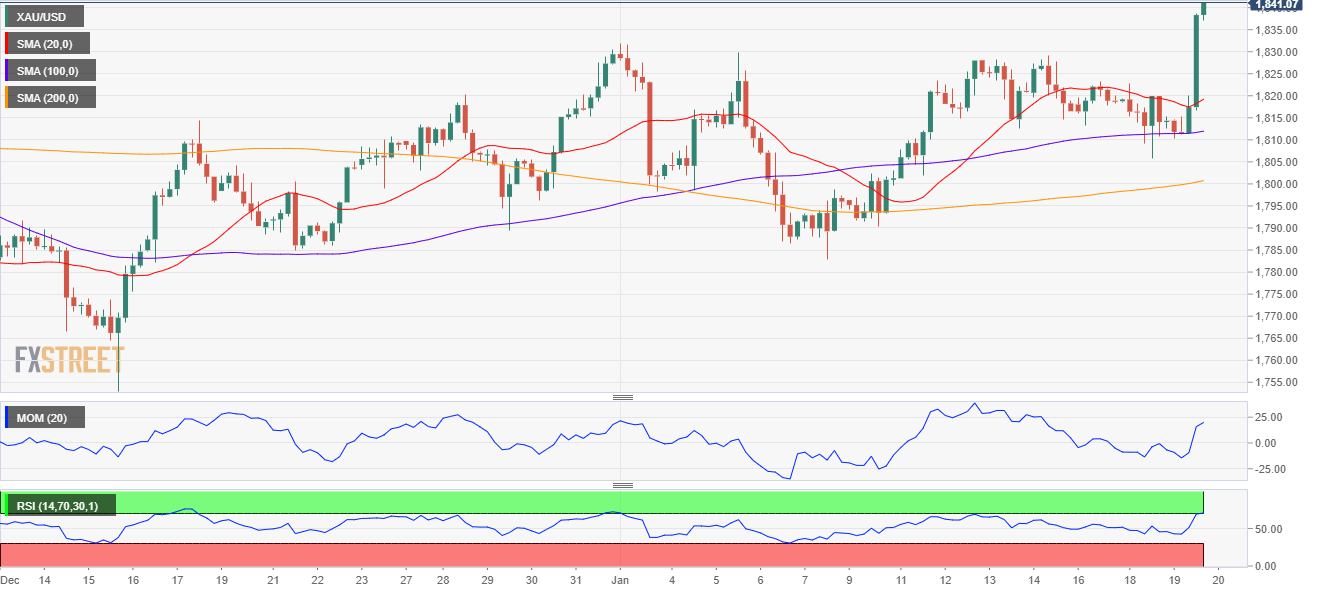
Gold price short-term technical outlook
The daily chart for the XAU/USD pair shows that it has bounced for a second consecutive day from around a bullish 20 SMA, which advances above directionless longer ones. Technical indicators, in the meantime, have turned higher after approaching their midlines, although the positive momentum remains limited.
The near term picture indicates substantial buying interest, as the latest two candles are quite long while extending below all of the moving averages. At the same time, technical indicators head firmly higher, approaching overbought readings. The next resistance level is 1,842.82, the low from November 11, with room for a test of November high at 1,877.15 on a break beyond it.
Support levels: 1,829.60 1,817.50 1,805.00
Resistance levels: 1,842.85 1,855.00, 1,866.90
Premium
You have reached your limit of 3 free articles for this month.
Start your subscription and get access to all our original articles.
Author

Valeria Bednarik
FXStreet
Valeria Bednarik was born and lives in Buenos Aires, Argentina. Her passion for math and numbers pushed her into studying economics in her younger years.


